|
|
|
 |
 |
|
Project Principal Investigators
|
||
|
James W. Fourqurean, Ph.D.
|
Michael J. Durako, Ph.D
|
Joseph C. Zieman, Ph.D.
|
|
|
||
| Project
Manager
|
||
|
Susie P. Escorcia
|
||
Contracts: NOAA - NA16OP2553; EPA X97468102-0
PROJECT OVERVIEW
The general objective of seagrass monitoring in the Florida Keys National Marine Sanctuary (FKNMS) is to measure the status and trends of seagrass communities to evaluate progress toward protecting and restoring the living marine resources of the Sanctuary. The scope and depth of this monitoring effort are without precedent or peer for seagrass ecosystems throughout the world. Specific objectives are: 1) To provide data needed to make unbiased, statistically rigorous statements about the status and temporal trends of seagrass communities in the Sanctuary as a whole and within defined strata; 2) To help define reference conditions in order to develop resource-based water quality standards; and 3) To provide a framework for testing hypothesized pollutant fate/effect relationships through process-oriented research and monitoring. In order to meet these objectives, we have developed these goals for the project:
!
Define the present distribution of seagrasses within the FKNMS!
Provide high-quality, quantitative data on the status of the seagrasses within the FKNMS!
Quantify the importance of seagrass primary production in the FKNMS!
Define the baseline conditions for the seagrass communities!
Determine relationships between water quality and seagrass status!
Detect trends in the distribution and status of the seagrass communitiesTo reach these goals, four kinds of data are being collected in seagrass beds in the FKNMS:
!
Distribution and abundance of seagrasses using rapid assessment Braun-Blanquet surveys!
Demographics of the seagrass communities using leaf-scar counting and population demographics techniques!
Seagrass productivity of the dominant species of seagrass in the FKNMS (Thalassia testudinum) using the leaf-mark and harvest method!
Seagrass nutrient availability using tissue concentration assaysThese data are being collected at three different types of sites within the FKNMS:
!
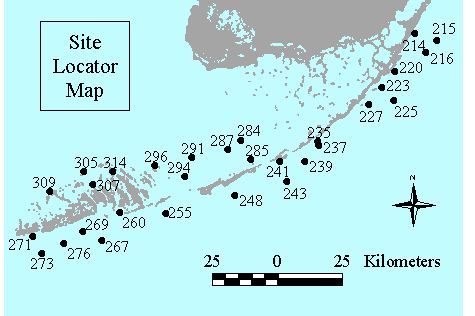
Level 1 Stations: Sampled quarterly for seagrass abundance, demographics, productivity and nutrient availability. These stations are all co-located with the water quality monitoring projectís stations (Figure 1)!
Level 2 Stations: Randomly selected locations within the FKNMS, sampled annually for seagrass abundance, demographics and nutrient availability. Each year, new locations for Level 2 stations are chosen.!
Level 3 Stations: Randomly selected locations within the FKNMS, sampled annually for seagrass abundance. Each year, new locations for Level 3 stations are chosen.We are assessing both inter-annual and intra-annual trends in seagrass communities. The mix of site types is intended to monitor trends through quarterly sampling at a few permanent locations (Level 1 sites) and to annually characterize the broader seagrass population through less intensive, one-time sampling at more locations (Level 2 and 3 sites).

Figure 1. Location of Level 1 seagrass status and trends monitoring sites in the Florida Keys National Marine Sanctuary. Site numbers correspond to water quality monitoring locations.
PROJECT ACCOMPLISHMENTS FY 2003
The significant changes in seagrass communities at the permanent Level 1 stations that we reported last fiscal year continue to be present after an additional year of sampling. These changes are consistent with model predictions of nutrient-induced changes of these systems. There may be reasons for these observations that are unrelated to manís activities in the region, but the spatial pattern of changes and the agreement of the changes with models of the system suggest that there is regional-scale change in nutrient availability that is causing changes in seagrass beds over a wide portion of the FKNMS.
In 2003, we resurveyed 202 Level 2 and Level 3 stations that were last visited during the summer of 1996. The data collected on these visits is still being assessed, but preliminary analyses indicate that there are no large spatial scale trends in the abundance of the dominant benthic plant types between the 2 years.
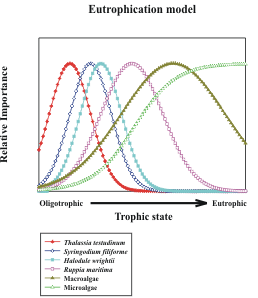
In general, nutrient addition to aquatic environments shifts the competitive balance to faster-growing primary producers. The consequences of this generality in seagrass-dominated environments is that seagrasses are the dominant primary producers in oligotrophic conditions. As nutrient availability increases, there is an increase in the importance of macroalgae, both free-living and epiphytic, with a concomitant decrease in seagrasses because of competition for light. Macroalgae lose out to even faster-growing microalgae as nutrient availability continues to increase: first, epiphytic microalgae replace epiphytic macroalgae on seagrasses; then planktonic microalgae bloom and deprive all benthic plants of light under the most eutrophic conditions. The south Florida case is more complicated than the general case described above because there are 6 common seagrass species in south Florida, and these species have different nutrient and light requirements, hence they have differing responses to eutrophication. Large expanses of the shallow marine environments in south Florida are so oligotrophic that biomass and growth of even the slowest-growing local seagrass species, Thalassia testudinum, are nutrient-limited; at this very oligotrophic end of the spectrum, increases in nutrient availability actually cause increases in seagrass biomass and growth rate. As nutrient availability increases beyond what is required by a dense stand of T. testudinum, there are other seagrass species that will out-compete it (Figure 2). The relative importance of the various primary producers, then, can be used to assess the trophic state of the community.
 |
|
| Figure 2. Conceptual model showing the change in importanceof primary producers as nutrient availability increases from low (oligotrophic) to high (eutrophic). | Figure 3. Conceptual model indicating how elemental ratios of seagrasses respond to increasing nutrient availability. |
Each species in the species dominance-eutrophication gradient model (Figure 2) can potentially dominate over a range of nutrient availability and the model predicts a change in species dominance as nutrient availability changes. These changes are not instantaneous, however. Field evidence suggests that species replacements may take place on a time scale of a decade or more. It is desirable that we be able to predict the tendency of the system to undergo these changes in species dominance before they occur, so that management actions can be taken. Tissue nutrient concentrations can be monitored to assess the relative availability of nutrients to the plants. For phytoplankton communities, this idea is captured in the interpretation of elemental ratios compared to the familiar "Redfield ratio" of 106C:16N:P. For the seagrass T. testudinum, the critical ratio of N:P in green leaves that indicates a balance in the availability of N and P is ca. 30:1, and monitoring deviations from this ratio can be used to infer whether N or P availabilities are limiting this speciesí growth. Hence, T. testudinum is likely to be replaced by faster-growing competitors if nutrient availability is such that the N:P of its leaves is ca. 30:1. A change in the N:P in time to a value closer to 30:1 is indicative of eutrophication (Figure 3). These models lead directly to a definition of trends likely to be encountered in the seagrass communities of south Florida if humans are causing regional changes in nutrient availability because of alterations to quantity and quality of freshwater inputs to the marine ecosystem:
1) regional eutrophication will cause N:P ratios of seagrasses to approach 30:1 from higher or lower values indicative of oligotrophic conditions; and
2) regional eutrophication will cause a shift in species dominance in south Florida seagrass beds. The first responses to eutrophication will be evidenced by an increase in the relative abundance of fast-growing seagrass species (H. wrightii and S. filiforme) at the expense of the now-dominant, slow-growing T. testudinum. At later stages of eutrophication, macroalgae and microalgae will become the dominant primary producers.
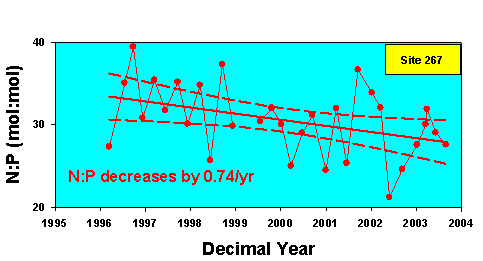
At 4 nearshore Level 1 sites in the Florida Keys, there has been an increase in the relative abundance of macroalgae over the period 1995 - 2003 that is consistent with an increase in nutrient availability. At none of these has there yet been a decrease in seagrass abundance, but our conceptual model predicts that increases in fast-growing macroalgae should precede decreases in seagrass abundance (Figure 2). One example, from site 235 offshore of Lower Matecumbe Key, shows how macroalgae have steadily increased in abundance over the monitoring period (Figure 4). In addition to these sites where relative abundance of primary producers has changed, at 4 more Level 1 sites there have been long-term shifts in the ratio of nitrogen to phosphorus in seagrass leaves that are consistent with increases in nutrient availability (Figure 5).
|
|
|
Figure 4.
At Level 1 station 235 (see figure 1 for location) there has been a slow and
consistent shift in species abundance, with faster-growing macroalgae becoming
more abundant over the time period. This change is consistent with model
predictions of the consequences of increases in nutrient availability.
|
 |
|
Figure 5.
At the Level 1 station 267 (see Figure 1 for location) there has been a slow
and consistent shift in N:P ratios from values consistent with P limitation
towards values indicating an increase in phosphorus availability.
|
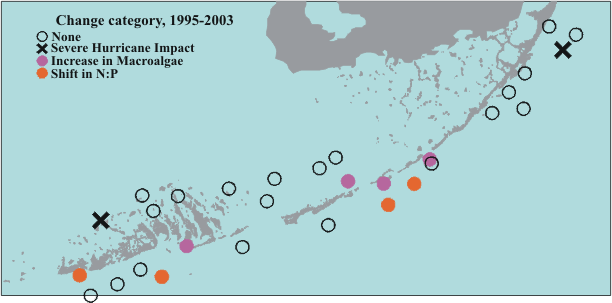
The sites that showed changes consistent with increased nutrient availability were not randomly distributed across the Sanctuary - rather, all of these sites were relatively close to shore in the Middle and Lower Florida Keys (Figure 6). The lack of any such changes in the Upper Florida Keys suggests that the factor driving the observed changes is not present across the entire Sanctuary, so factors acting at the global scale (like global warming or coastal overfishing) are not likely responsible for the observations. In addition to Level 1 sites that are exhibiting changes that are consistent with long-term increase in nutrient supply, two additional sites were severely impacted by hurricanes over the course of the monitoring period.
 |
| Figure 6. Long-term changes in seagrass beds at the Level 1 sites. |
Resurveying the Level 2 and Level 3 sites revealed no spatially consistent patterns in changes in relative abundance of seagrass communities from throughout the sanctuary. The mean changes in Braun Blanquet density for the major taxa for the period 1996 and 2003 were not significantly different from zero (Figure 7), but there were some locations that had large differences between 1996 and 2003. Whether these changes were real changes in the benthic communities or artifacts caused by small scale spatial heterogeneity is currently being investigated. There were some areas, like around Islamorada, that showed declines in Thalassia in a large area contiguous with
Level 1 permanent sites that exhibited changes that are consistent with eutrophication (See figure 8 for spatial pattern of change, and Figure 6 for Level 1 site summary). However, other regions of apparent change were not consistent with the patterns seen at the permanent sites. In FY 2004, we will resample an additional 200 sites that were surveyed in 1997.
|
|
| Figure 7. Frequency distributions of the changes in Braun-Blanquet density for the three most common taxa based on revisiting 202 sites in 2003 that were originally surveyed in 1996. The mean change in density for all three taxa is not different from zero. |
 |
| Figure 8. Spatial pattern in the changes in the Braun-Blanquet density of Thalassia testudinum at Level 2 and Level 3 sites surveyed in 1996 and revisited in 2003. |
Our surveys have provided clear documentation of the distribution and importance of seagrasses in the FKNMS. The seagrass bed that carpets 80% of the FKNMS is part of the largest documented contiguous seagrass bed on earth. These extensive meadows are vital for the ecological health of the FKNMS and the marine ecosystems of all of south Florida. Maps of spatial distributions can be found on the web or DVD.
Our permanent monitoring sites have provided valuable data on the inter- and intra-annual variability of seagrass cover and abundance. Time series of species composition, seagrass productivity, nutrient availability and physical parameters can be found for each permanent monitoring site on the web site or the DVD. There have been some striking trends in the seagrass communities at these permanent sites: seagrasses were lost completely at 3 of the 30 sites during hurricanes over the last 4 years. At the remaining 27 sites, the benthic communities are relatively stable. There are no common trends across the sites in seagrass cover or community composition. This can be interpreted to mean that there are no regional trends in the health of the seagrass beds represented by the permanent monitoring sites that can be detected with the 6 years of monitoring data. But, manipulative experiments in seagrass beds in south Florida demonstrate that the time course of the response of seagrass beds to eutrophication is on the order of decades, and we do not understand completely the interaction man has with the natural dynamics of these systems. These 30 sites should continue to be monitored on a quarterly basis.
Detailed analyses of the monitoring data have led to 17 peer-reviewed publications in the peer-reviewed scientific literature. These publications address aspects of the functioning, status and trends of benthic communities as well as lay the groundwork for forecasting future anthropogenic impacts on this ecosystem.
Acknowledgments
This data report represents the dedicated work of many people. Craig Rose, Alan Willsie, Brad Peterson, and Leanne Rutten led the field collection efforts and spearheaded the compilation of the data report; Meredith Ferdie, Dottie Byron, Virginia Cornett, Sean Meehan and Kevin Cunniff collectively put in the thousands of hours in the field and laboratory that went into the collection of these data. The field work was conducted under permits FKNMS-2003-036 from the FKNMS, FDEP permit number 1587, FDEP Parks and Recreation Permit number 5-04-09, and permit number DRTO-2003-SCI-0009 from the National Park Service.