Mosquito Lagoon temperature graphics
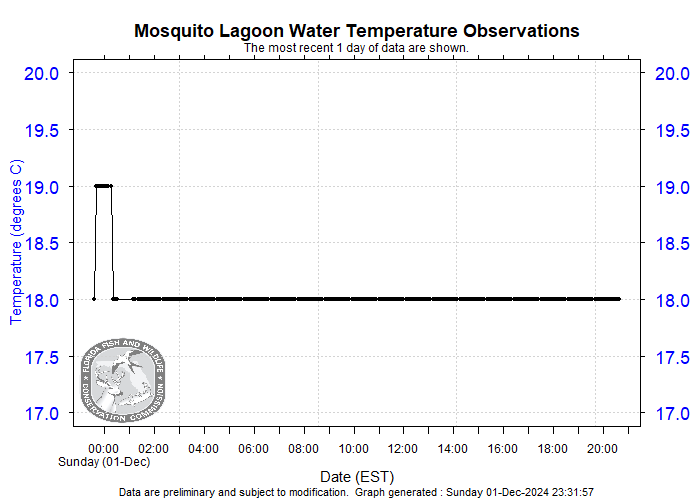
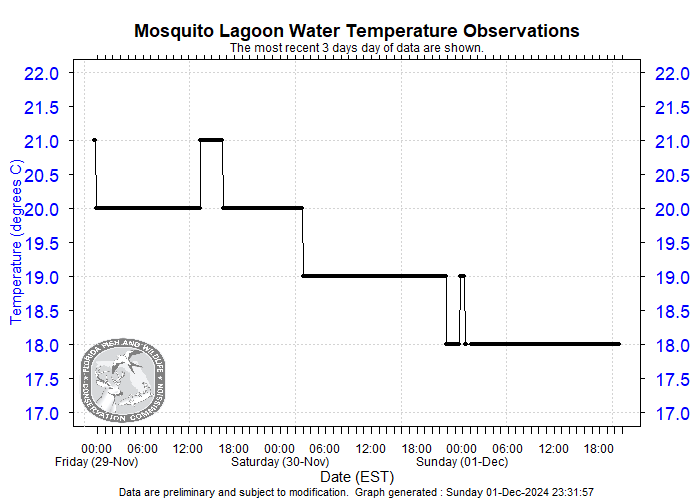
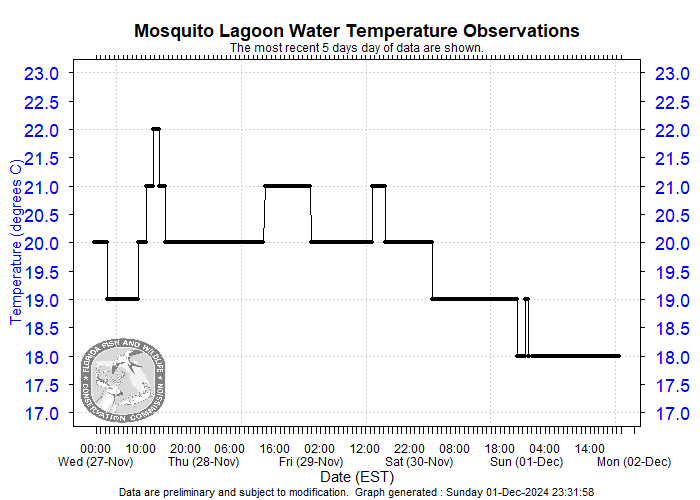
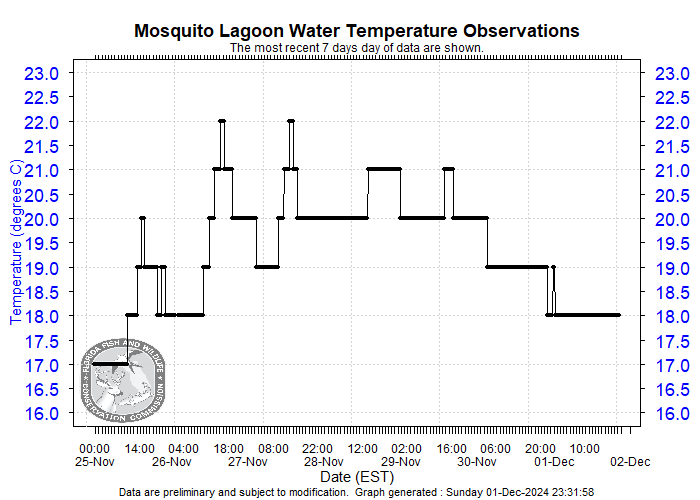
Click the images below to download static graphs of data collected during the last 1, 3, 5 and 7 days. The graphics and data are updated hourly.
Mosquito Lagoon cold-stunning outlook
This cold-stunning outlook discussion is provided by FWC's Marine Turtle Research Program and is updated regularly.
Data
The most recent 24 hours of water temperature data collected from Mosquito Lagoon. Click the date and temperature headings to sort the data. Additional data from this station can be downloaded from the Information page. This table is updated hourly.
Daily summary of Mosquito Lagoon water temperatures. Daily minimum, maximum and average temperatures are provided. The field "Duration (<10)" reflects the length of time (in hours) that water temperatures were continuously at or below the 10°C threshold. The climatological mean and the standard error of the mean are calculated using data collected on the same date during previous deployments. Refer to the climatology for more details. This 7-day summary is updated daily, by 0830 and 1830 EST.
A climatology is also available for Mosquito Lagoon. It summarizes water temperature data collected during previous winters.
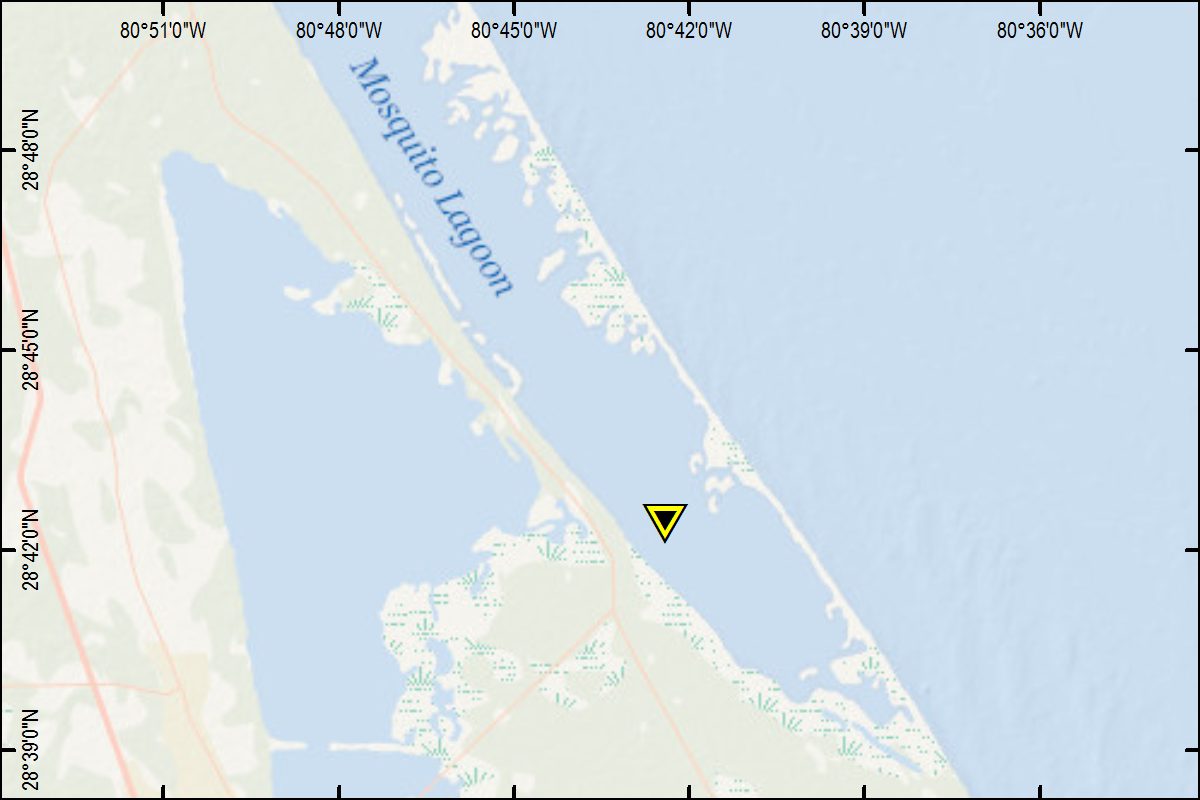
Station location
This monitoring station is located in southern Mosquito Lagoon.
Weather information
This air temperature and wind forecast is provided by WindAlert.
Area forecast discussion from the National Weather Service.
