Saint Johns County, Florida
Numbers of stranded sea turtles documented in Saint Johns County during 2025 by week and species. The previous five-year and ten-year averages, as well as the cumulative totals are also given. Graphical representations of stranded sea turtles in Saint Johns County during 2022 and previous years are shown below this table.
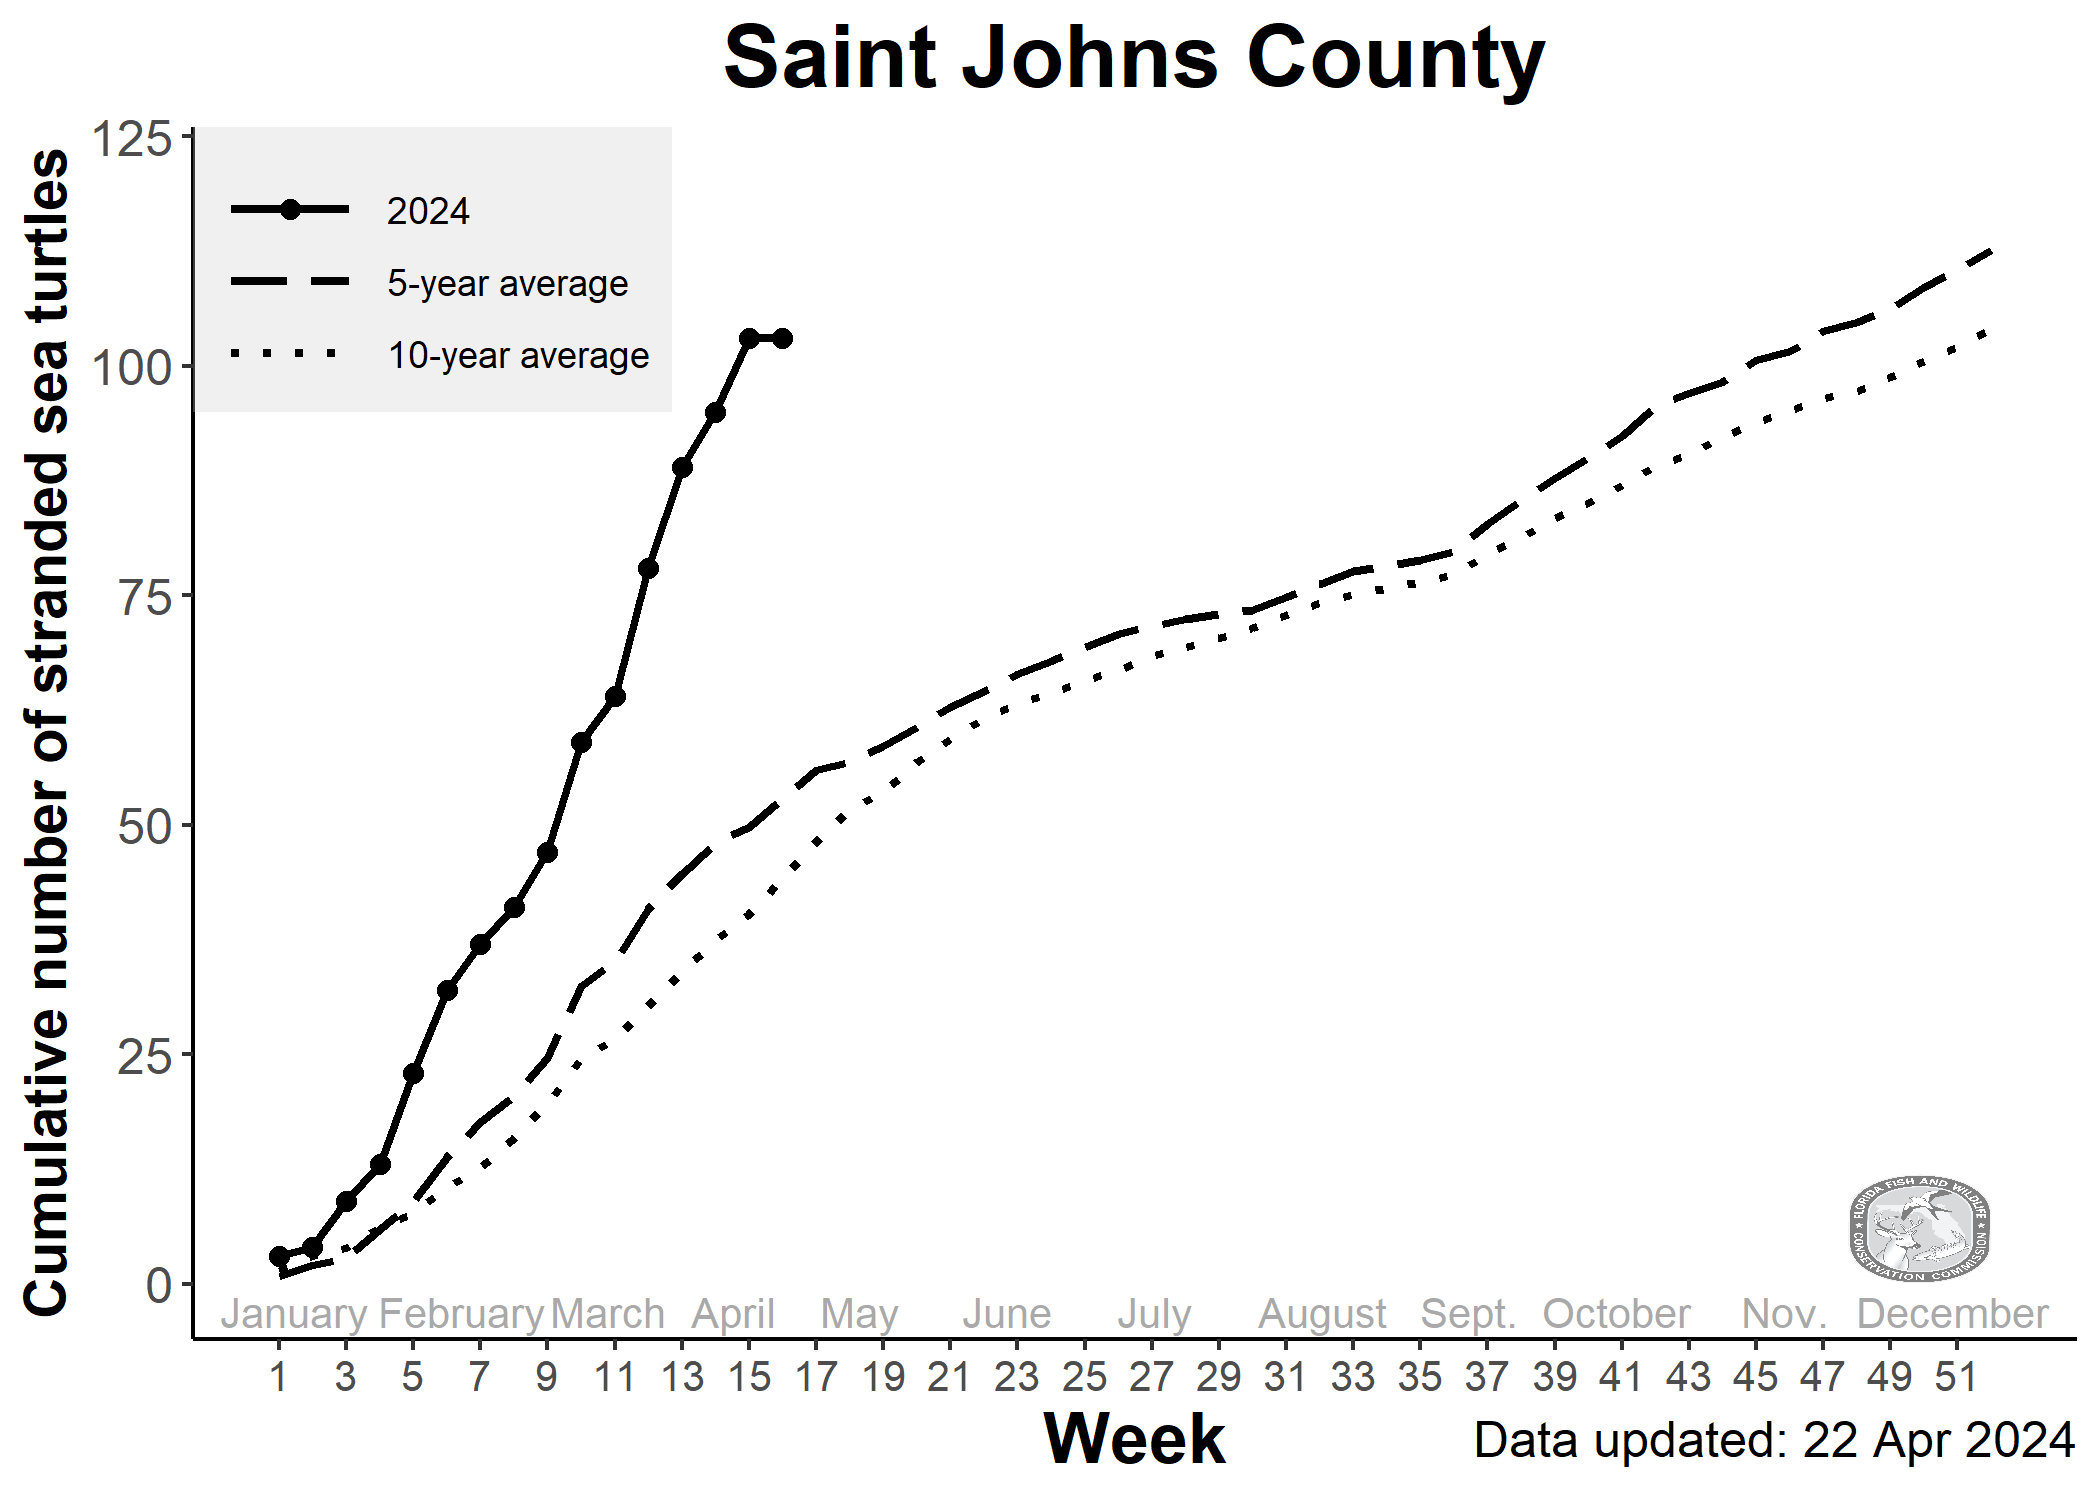
Cumulative numbers of stranded sea turtles in Saint Johns County during 2025 (ongoing) and the previous 5-year and 10-year averages.
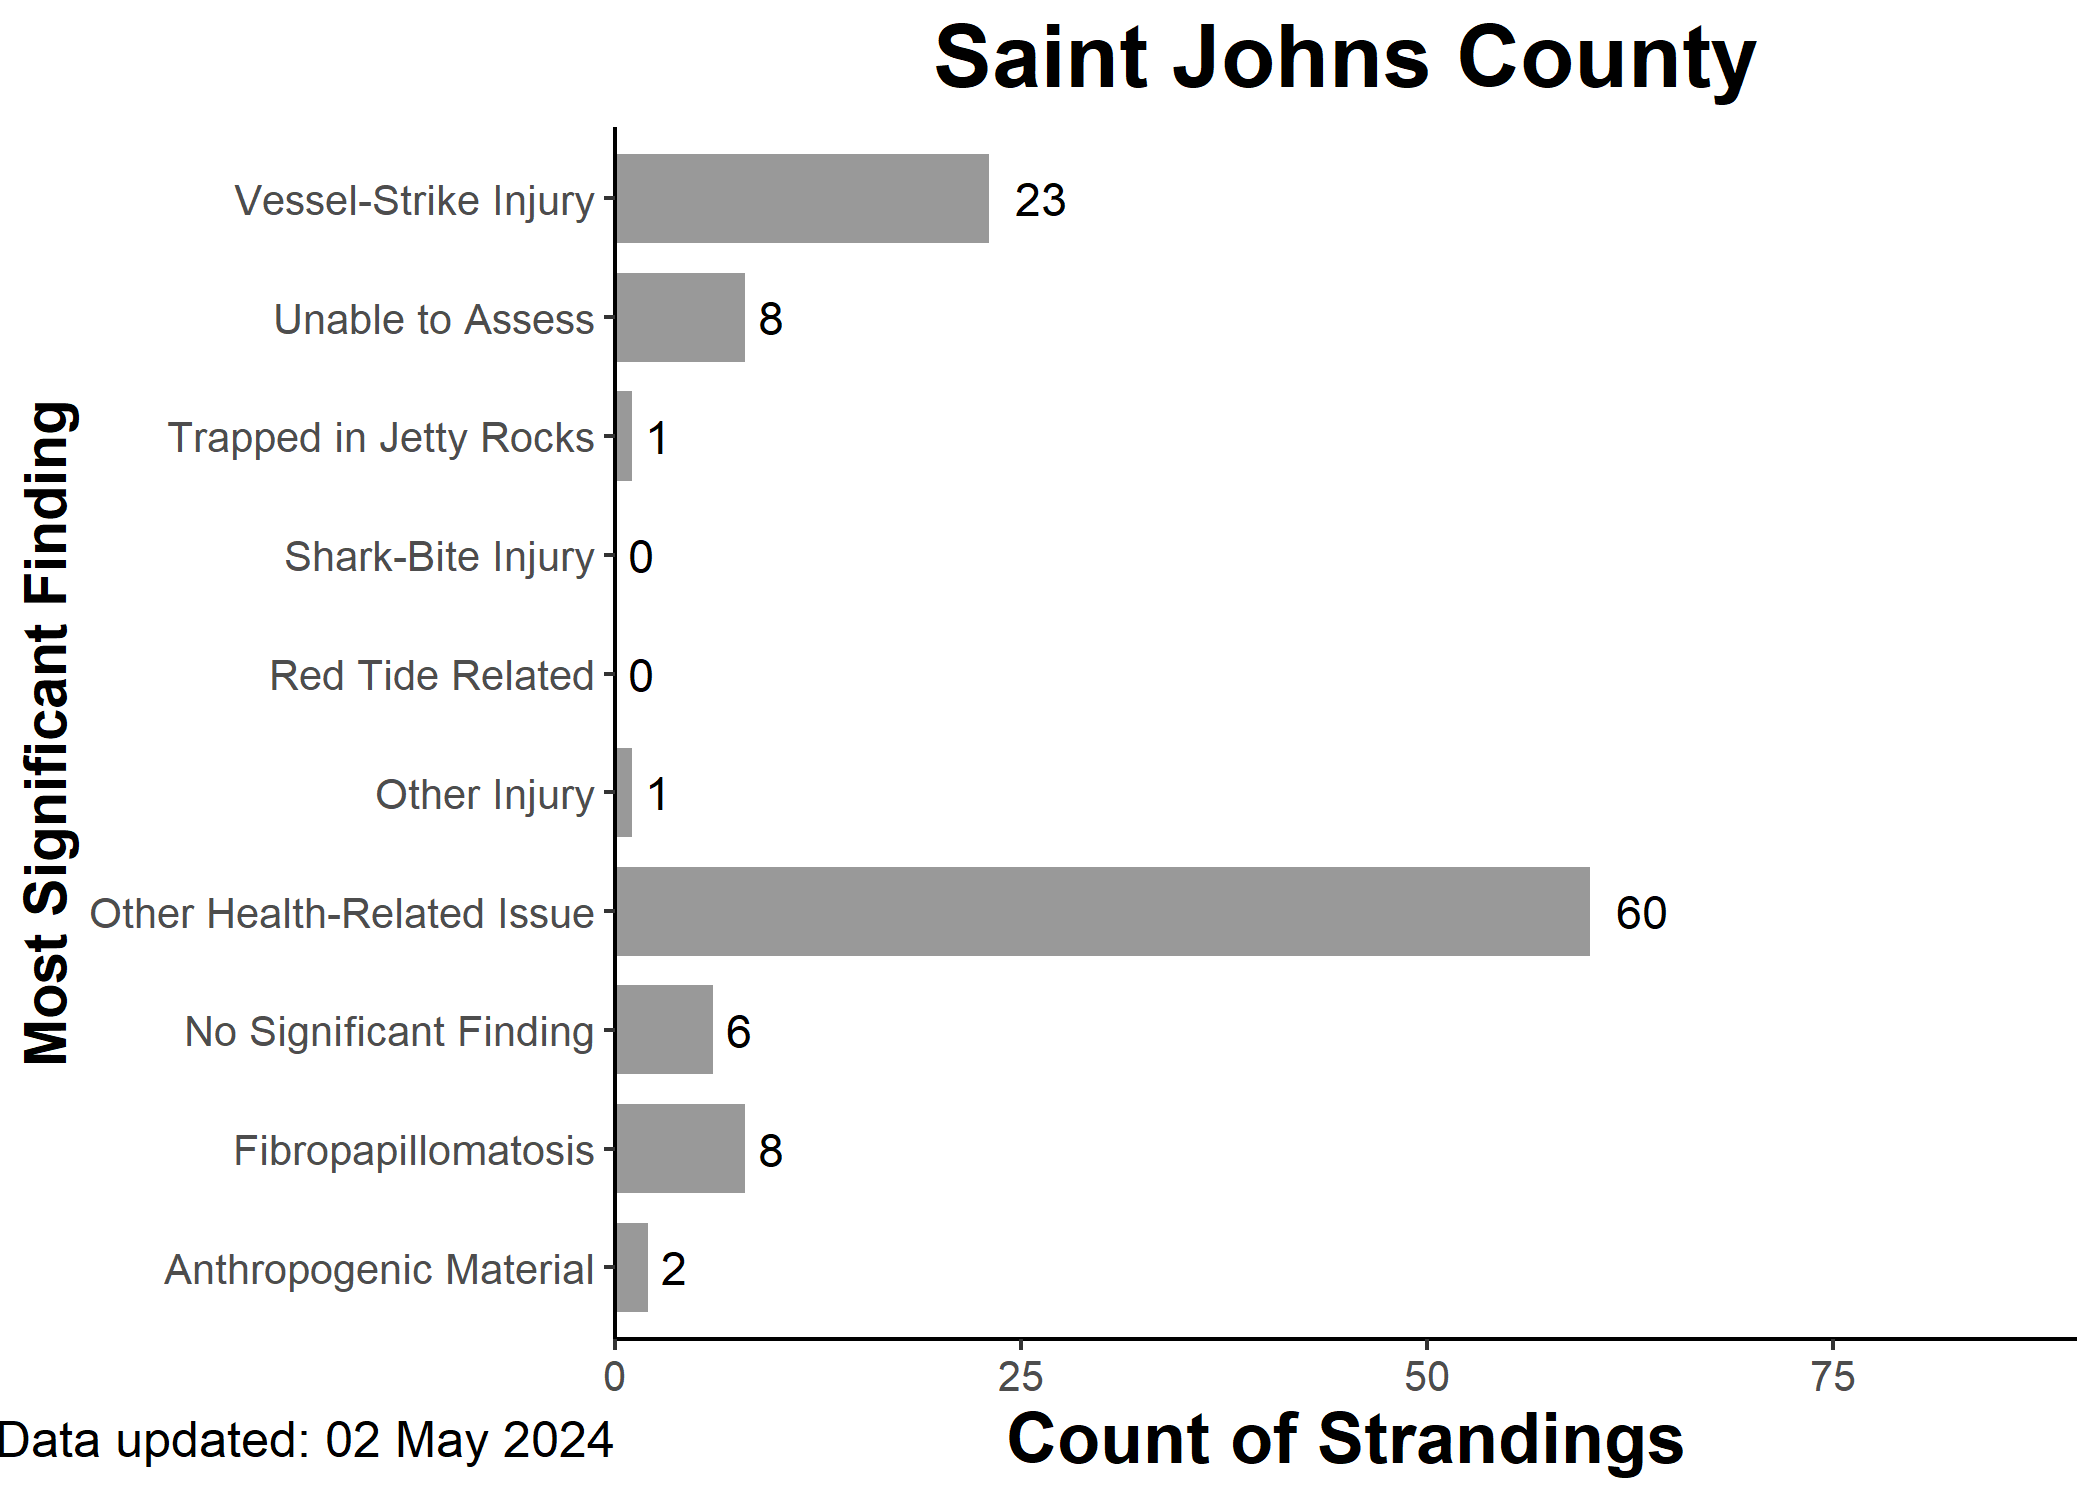
Counts of strandings in Saint Johns County grouped by their most significant finding which is determined based on observed injuries and anomalies.
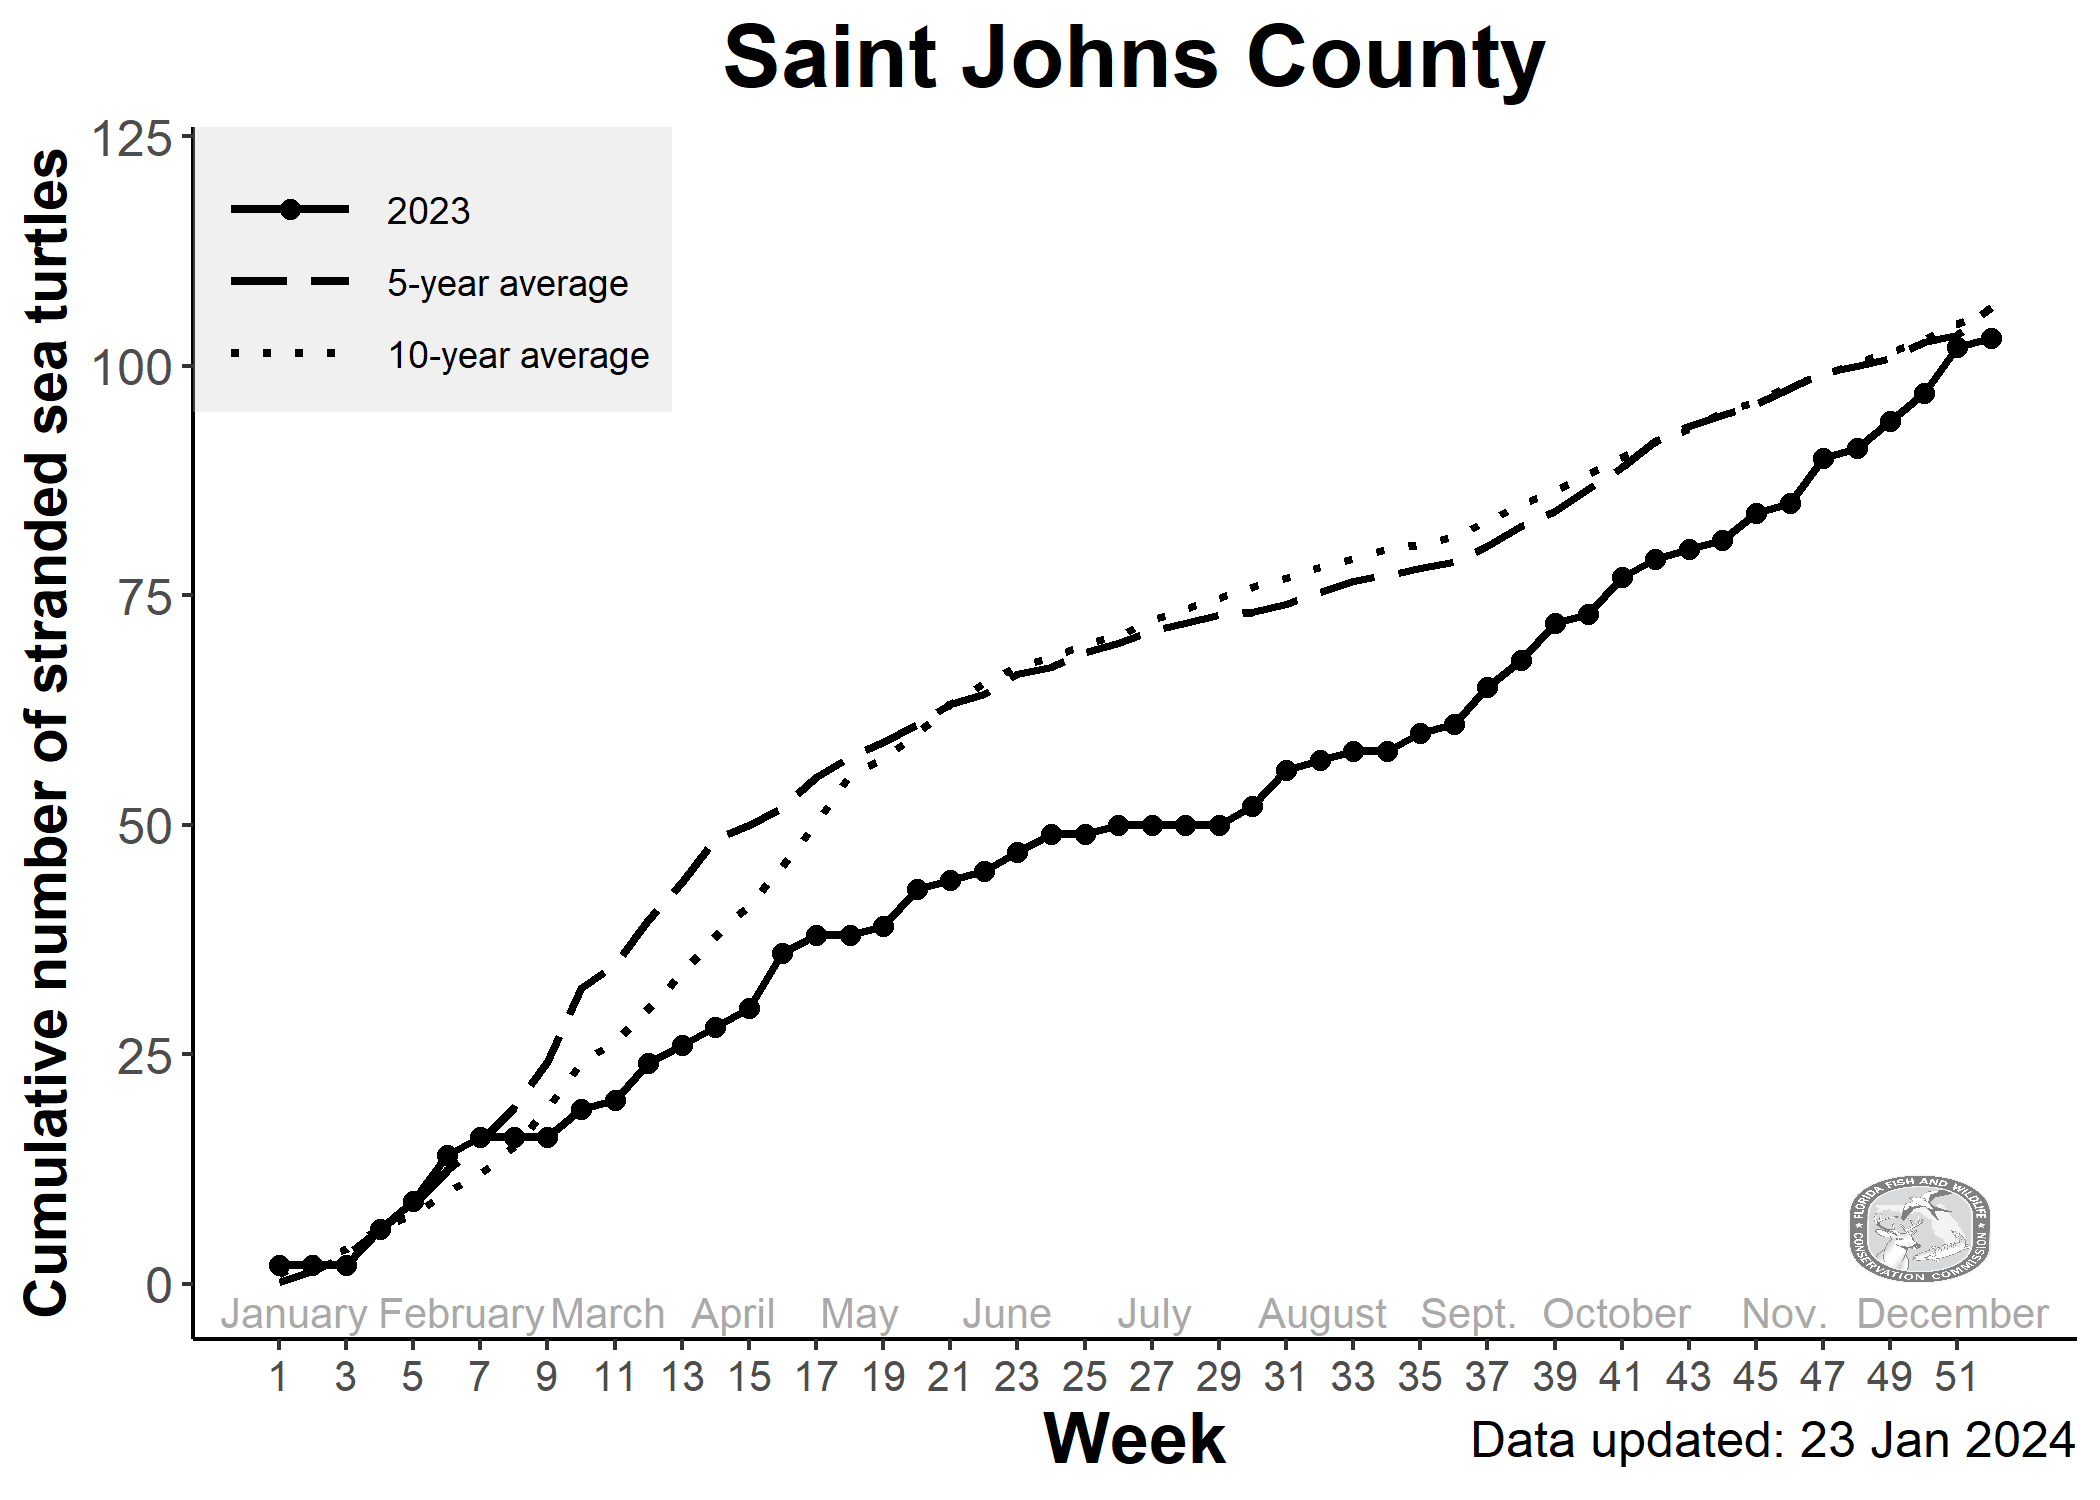
Cumulative numbers of stranded sea turtles in Saint Johns during 2023 and the previous 5-year and 10-year averages.
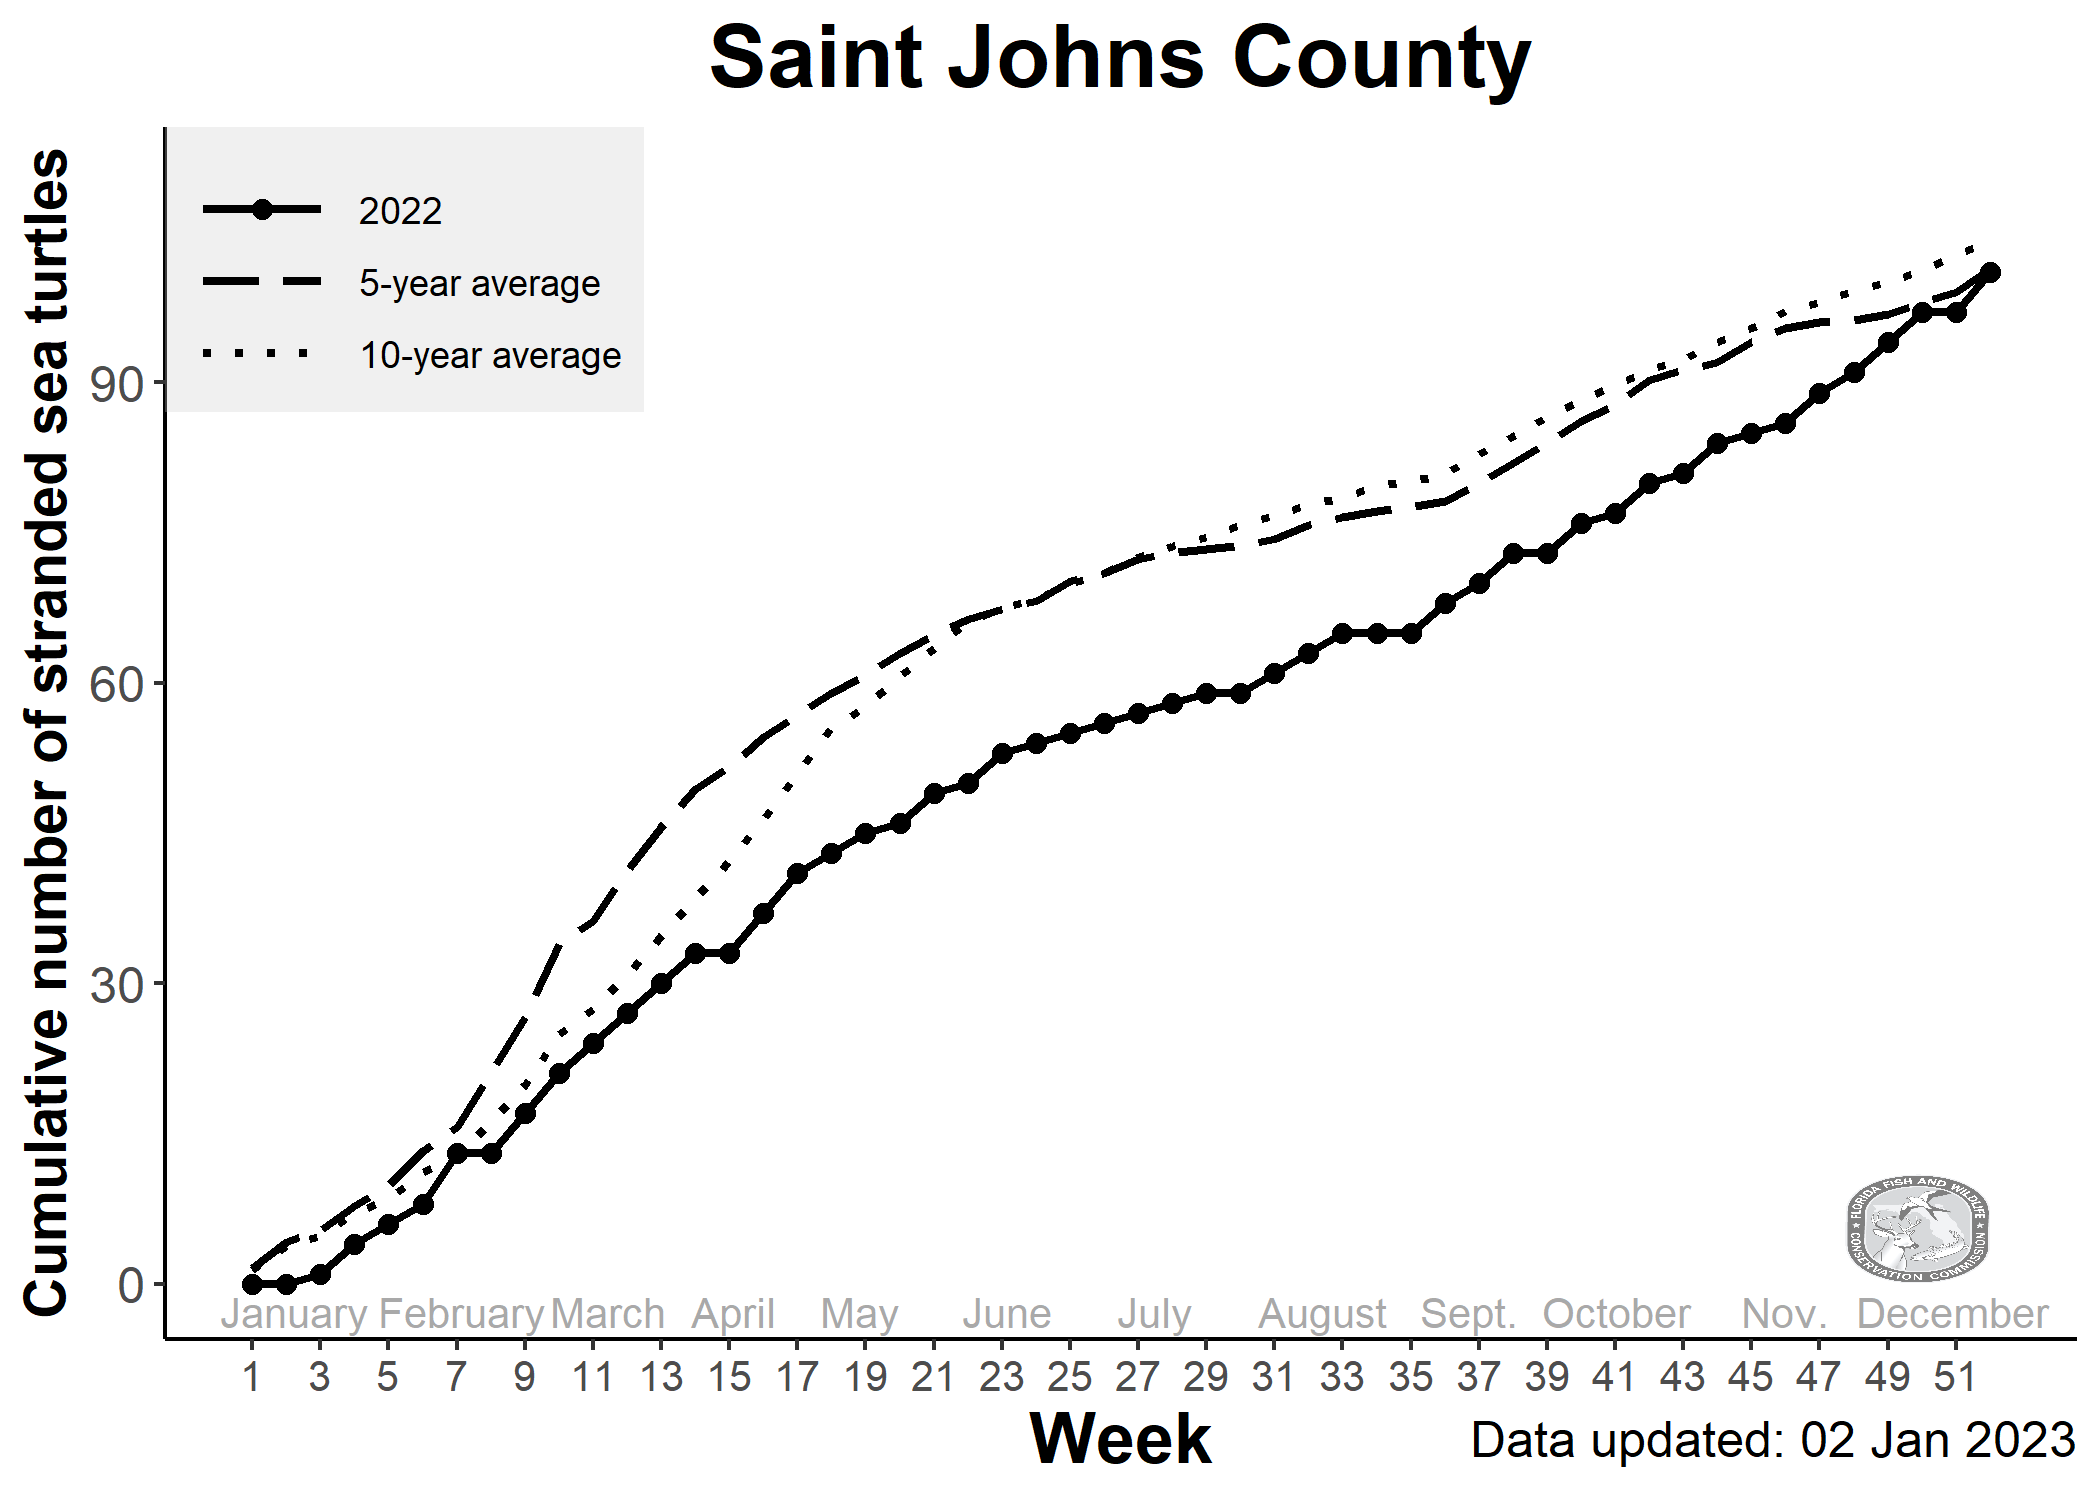
Cumulative numbers of stranded sea turtles in Saint Johns during 2022 and the previous 5-year and 10-year averages.
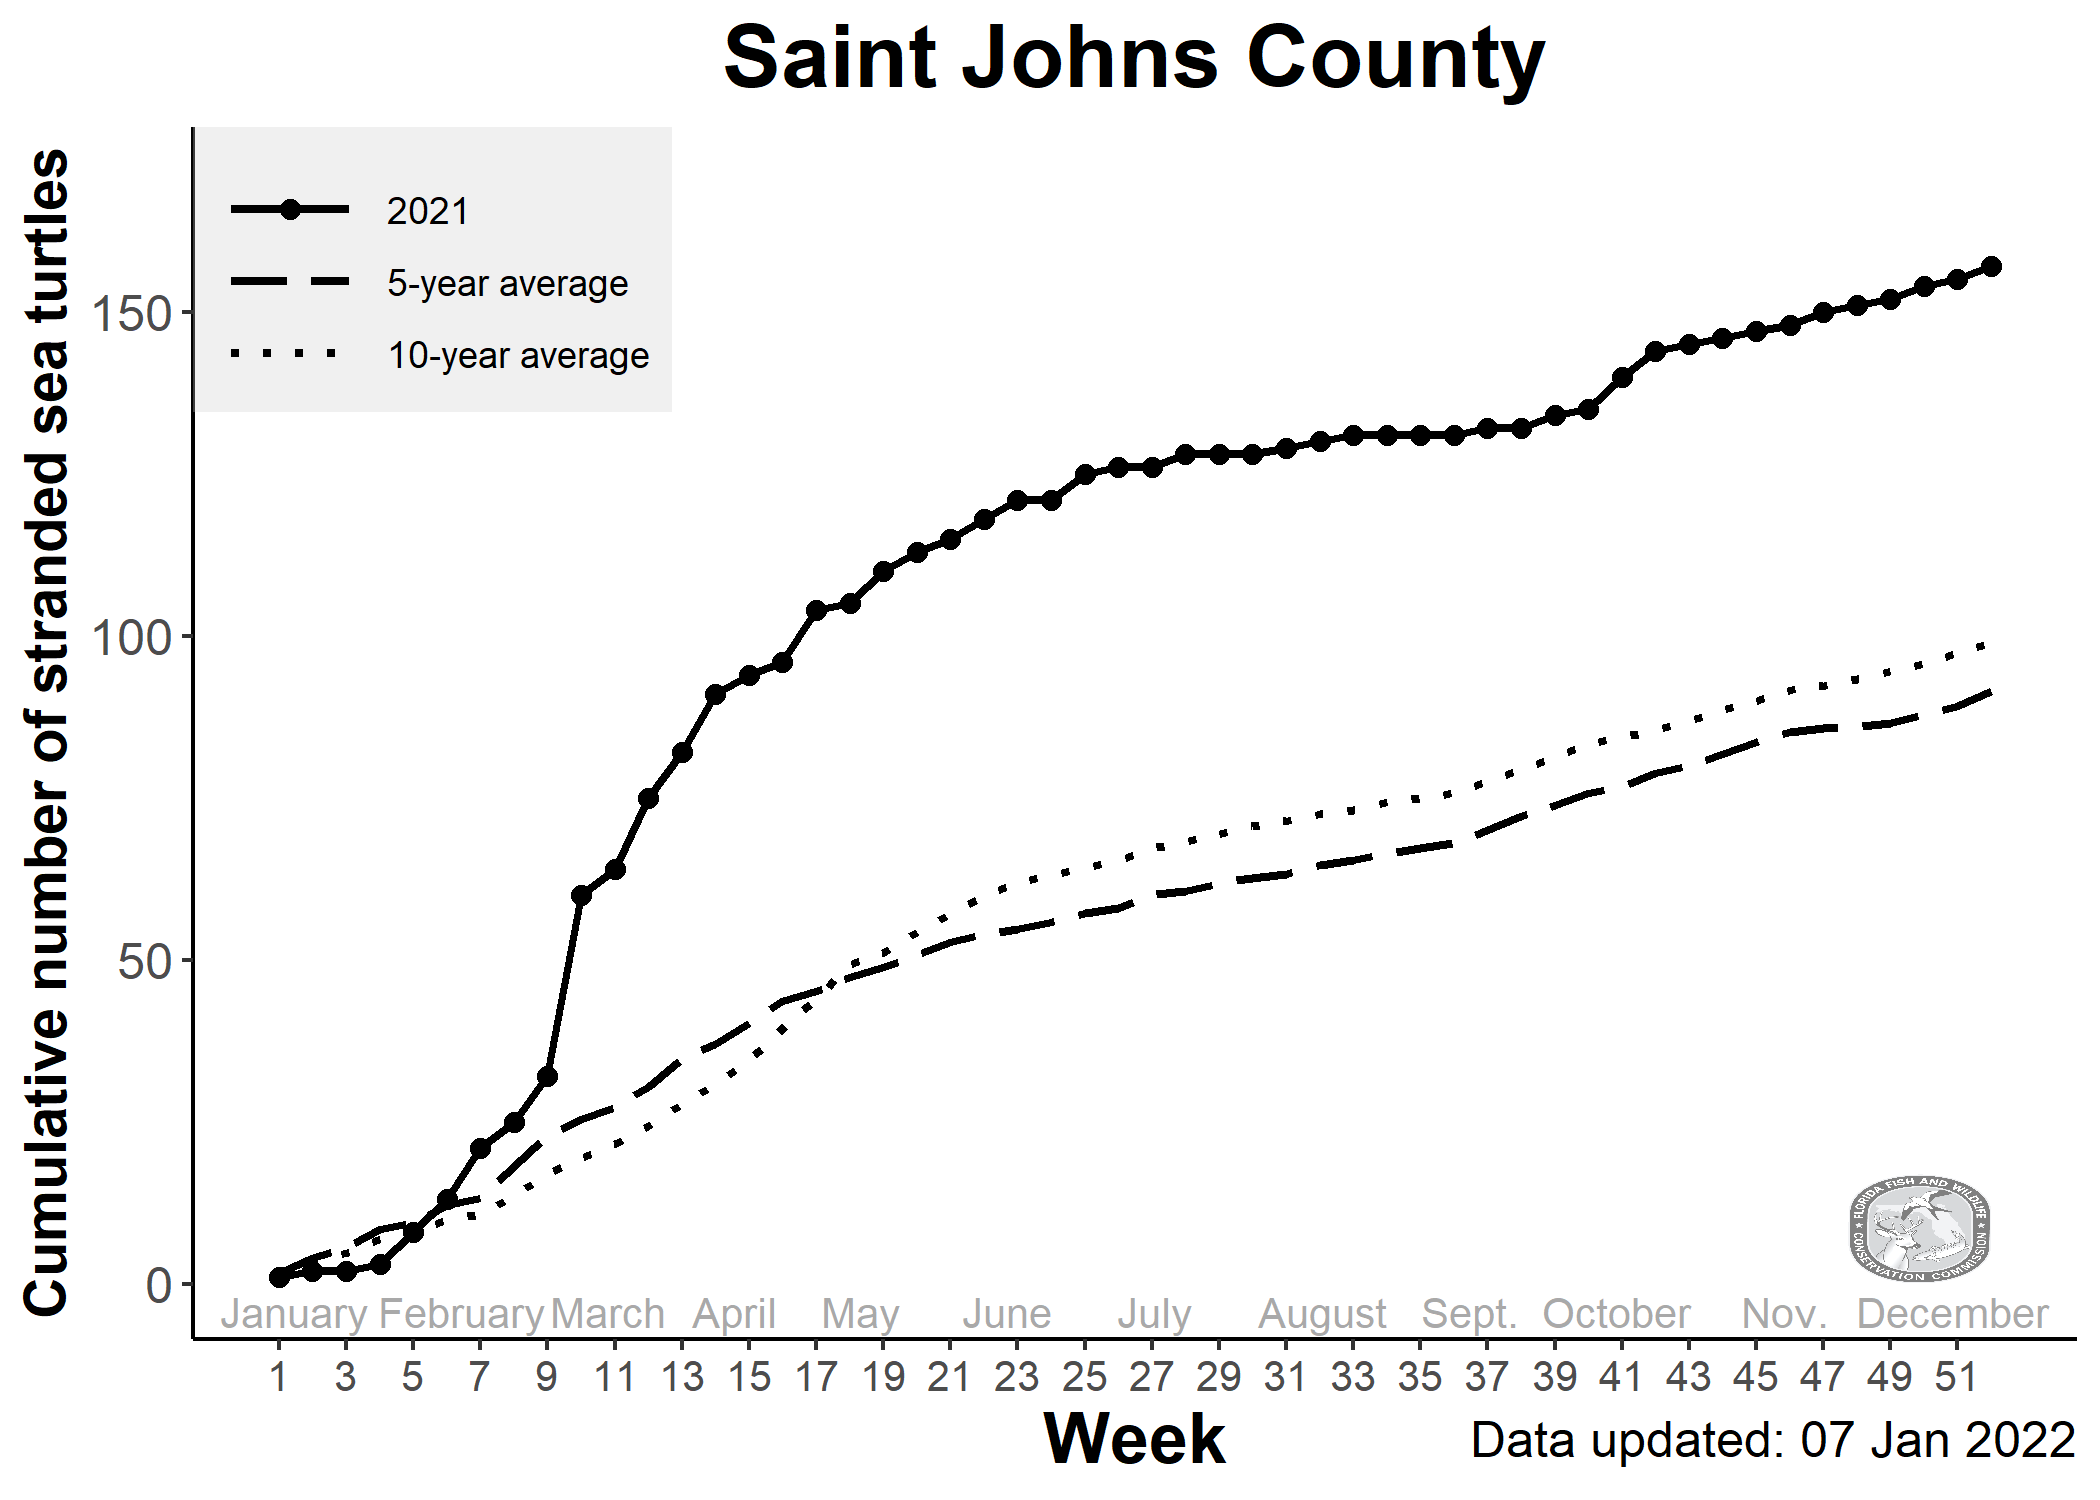
Cumulative numbers of stranded sea turtles in Saint Johns during 2021 and the previous 5-year and 10-year averages.
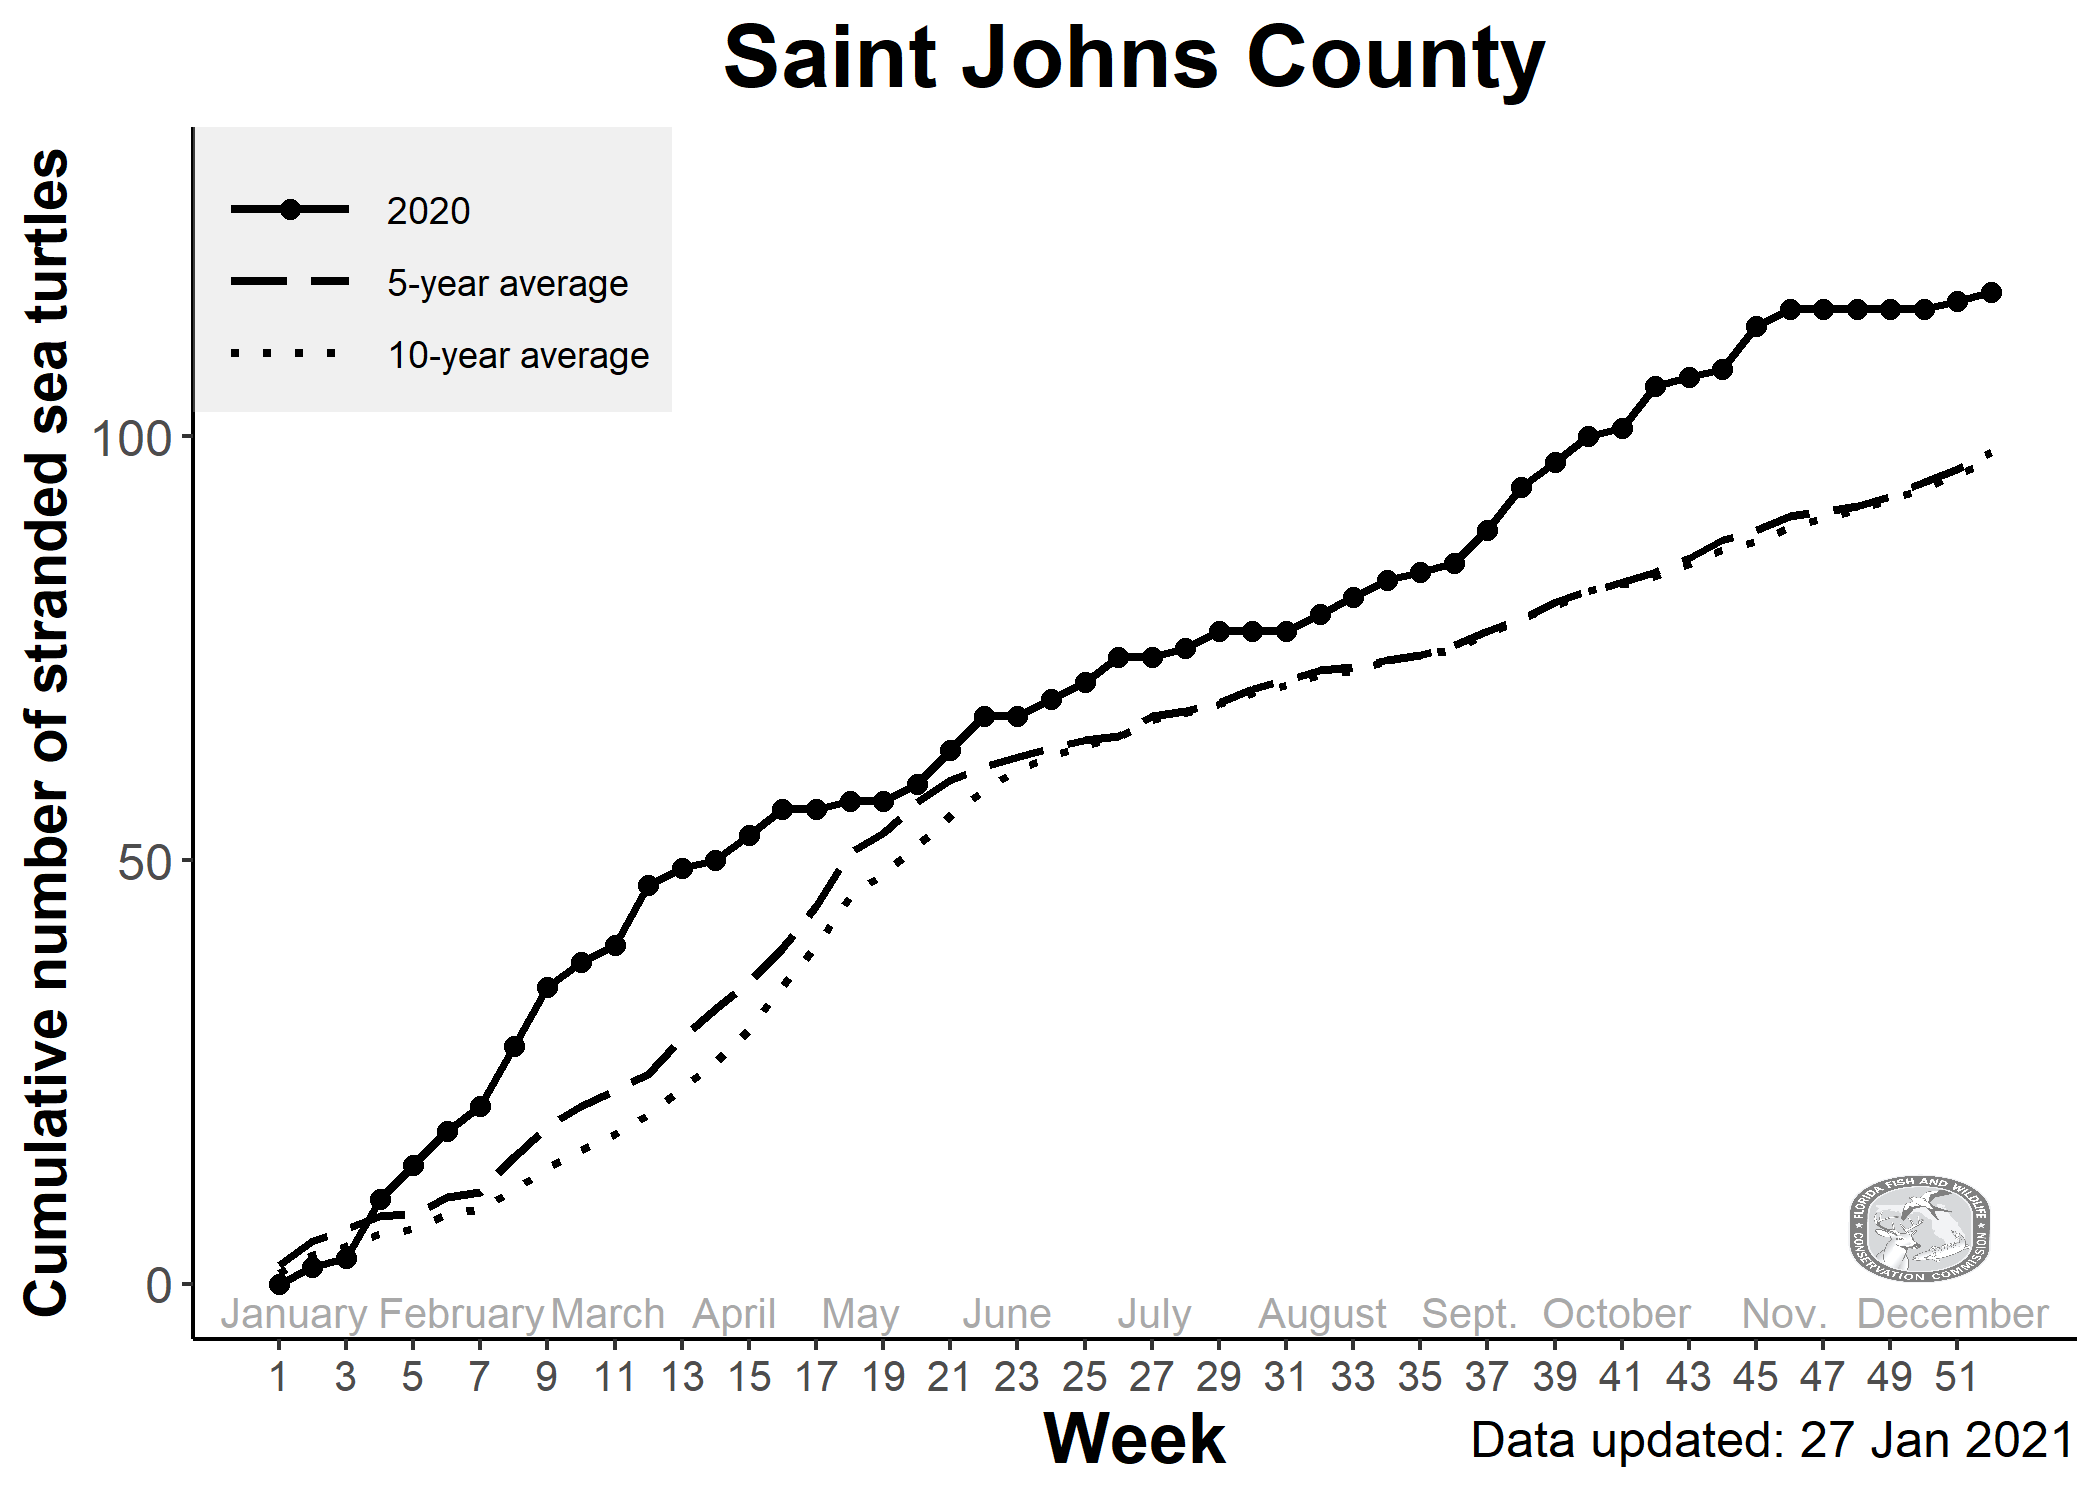
Cumulative numbers of stranded sea turtles in Saint Johns during 2020 and the previous 5-year and 10-year averages.
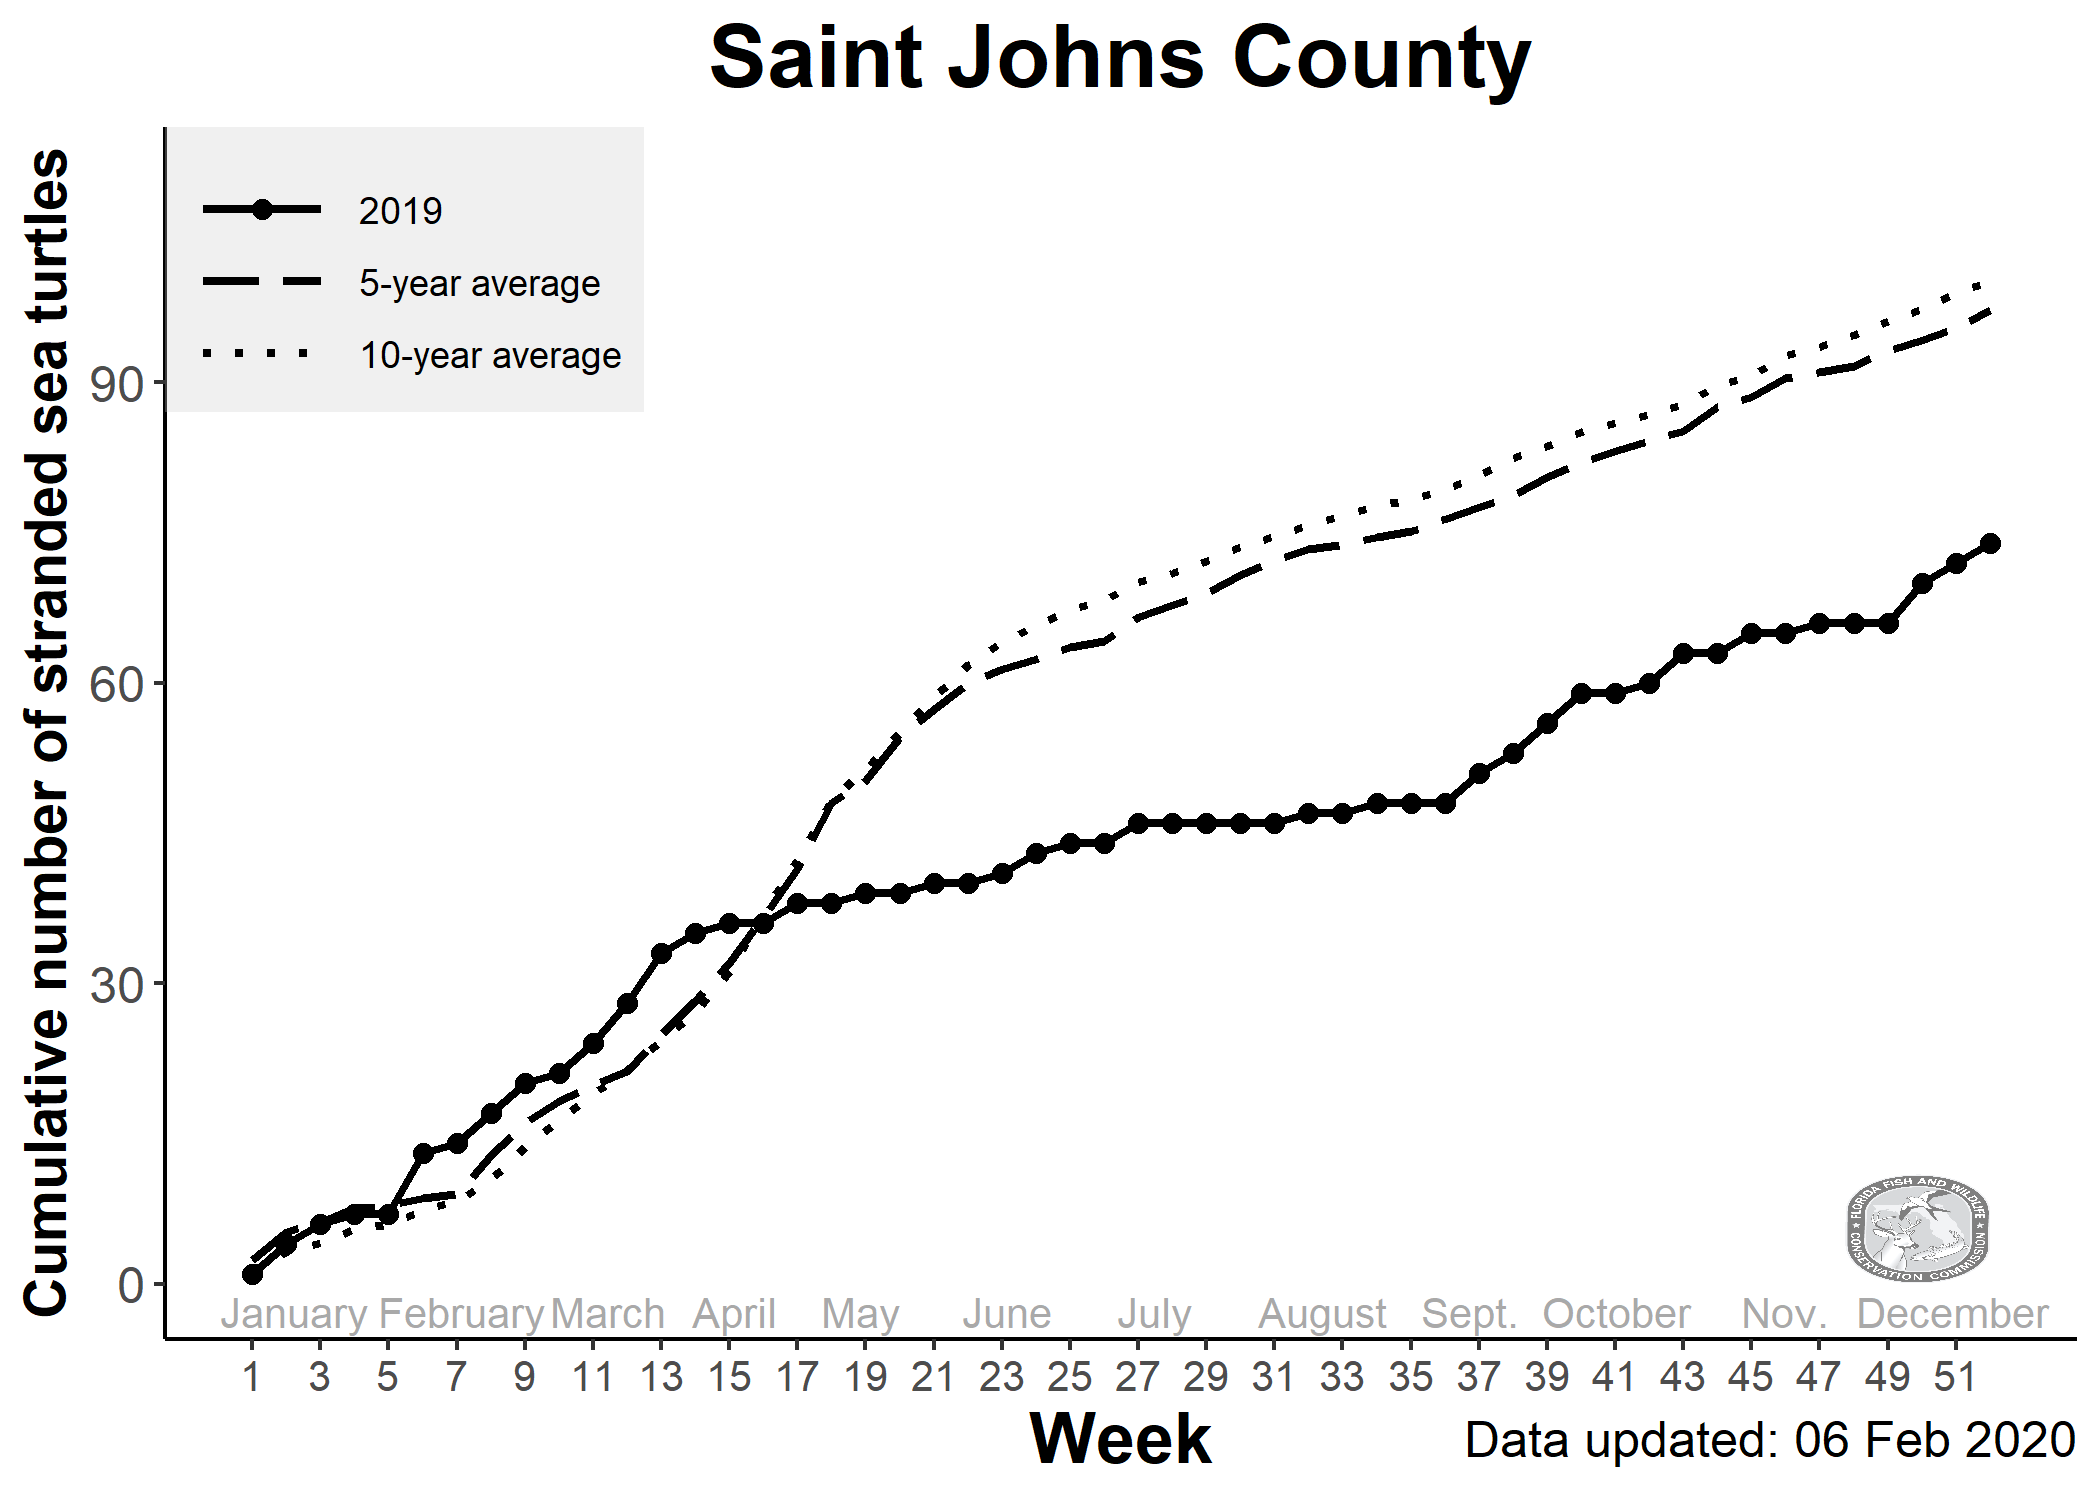
Cumulative numbers of stranded sea turtles in Saint Johns during 2019 and the previous 5-year and 10-year averages.
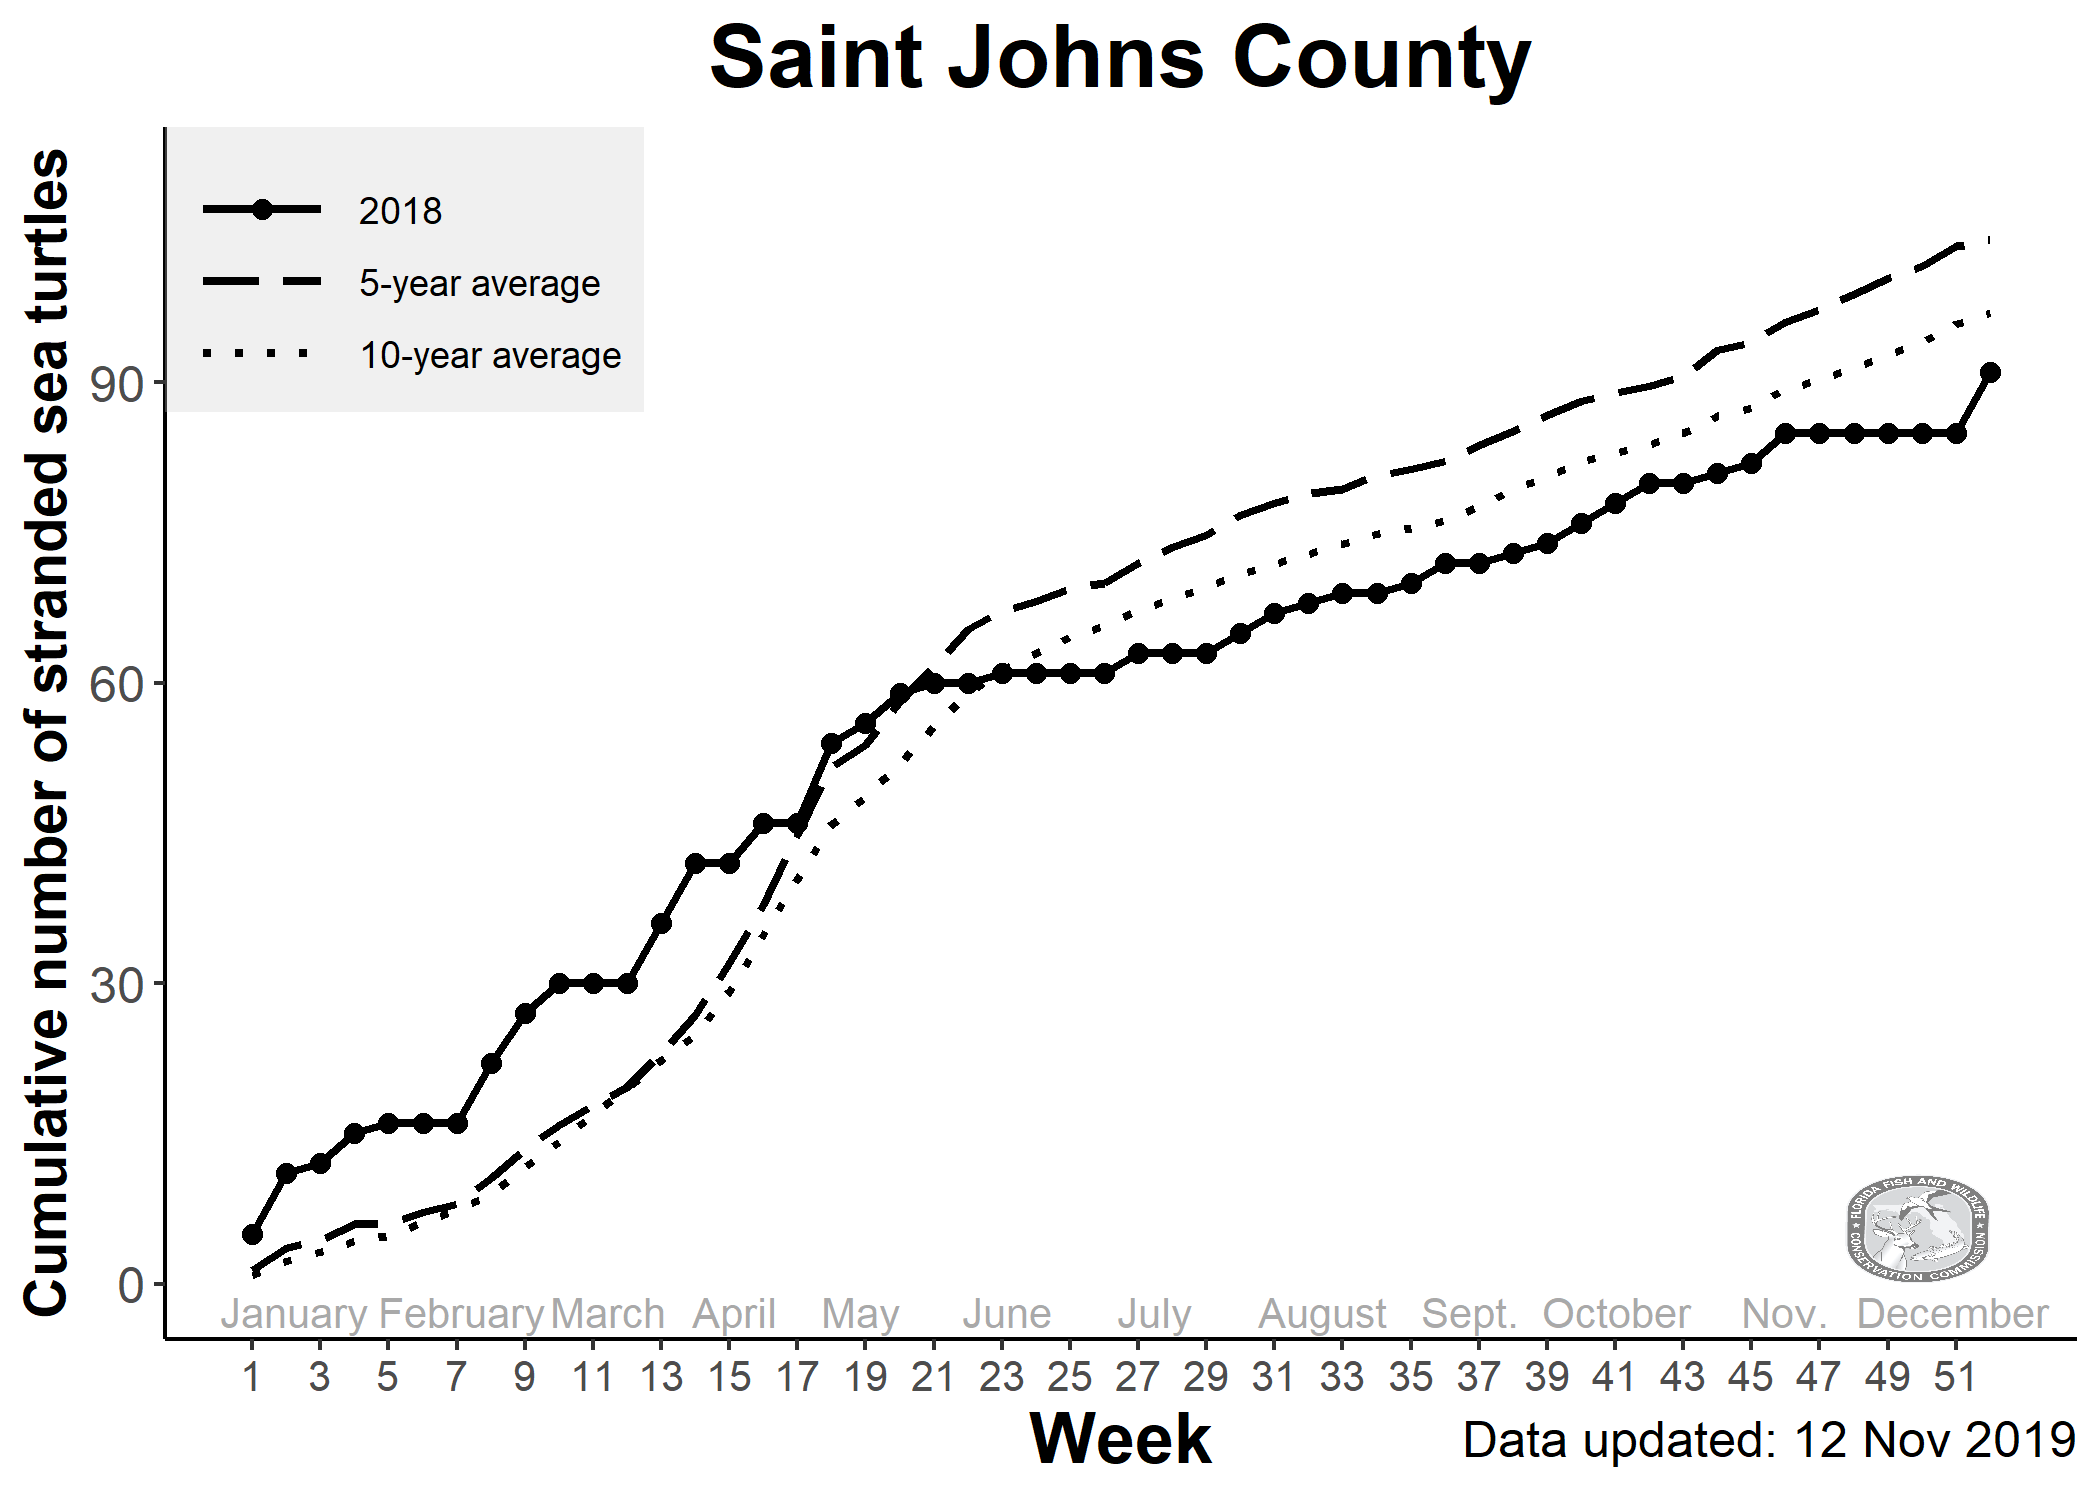
Cumulative numbers of stranded sea turtles in Saint Johns during 2018 and the previous 5-year and 10-year averages.
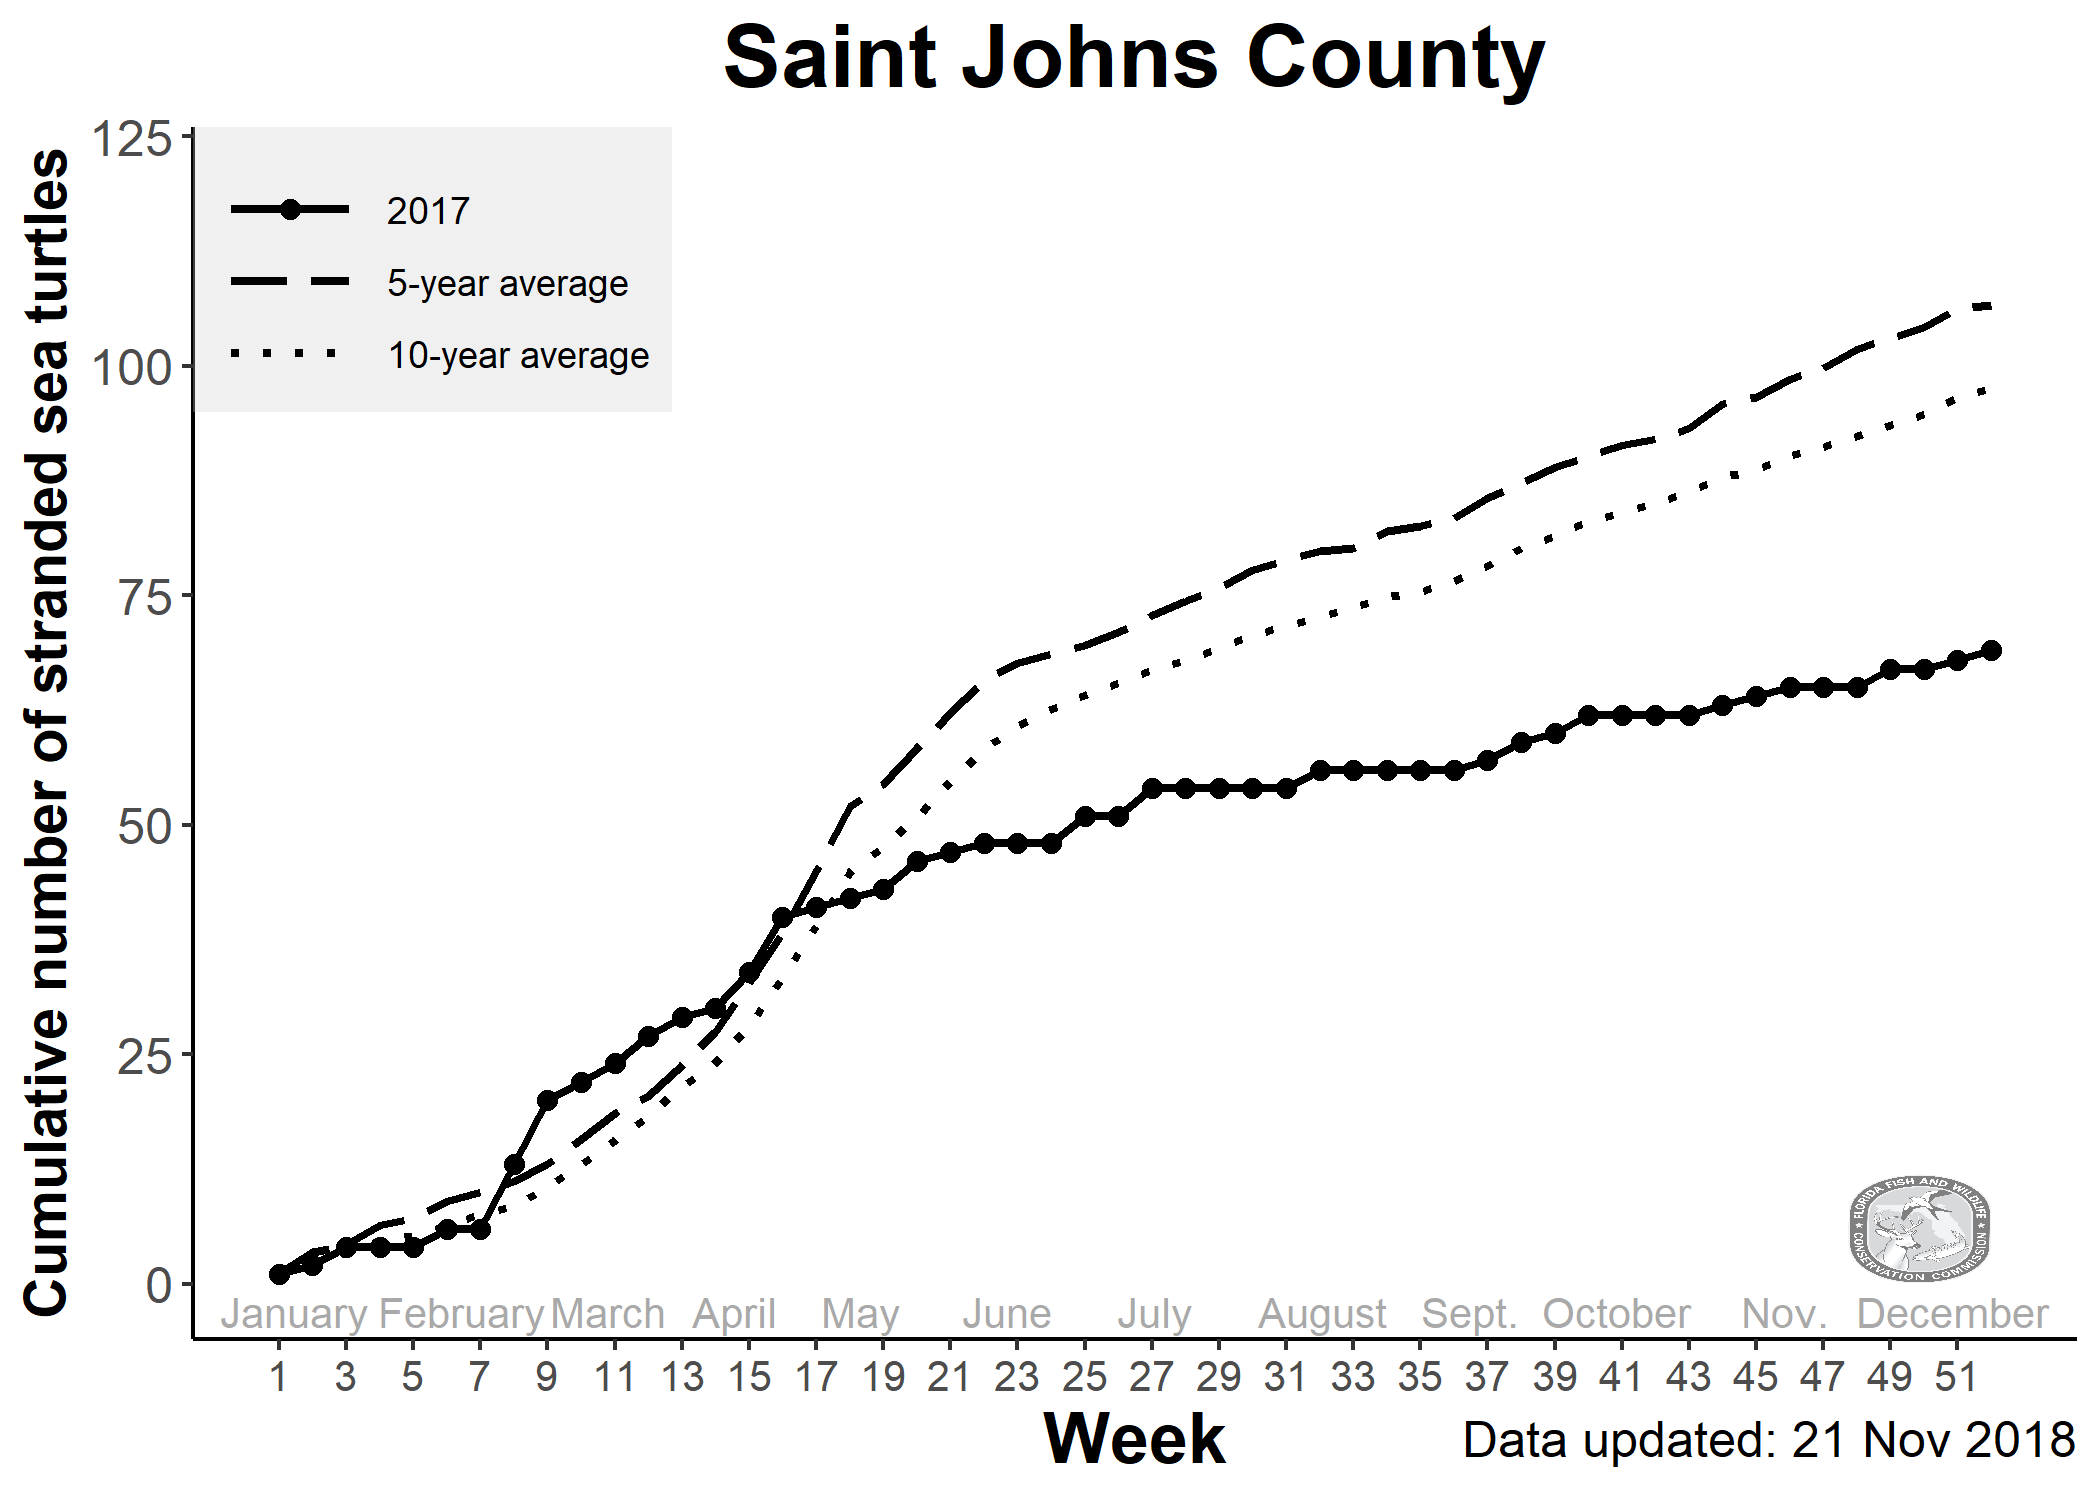
Cumulative numbers of stranded sea turtles in Saint Johns during 2017 and the previous 5-year and 10-year averages.
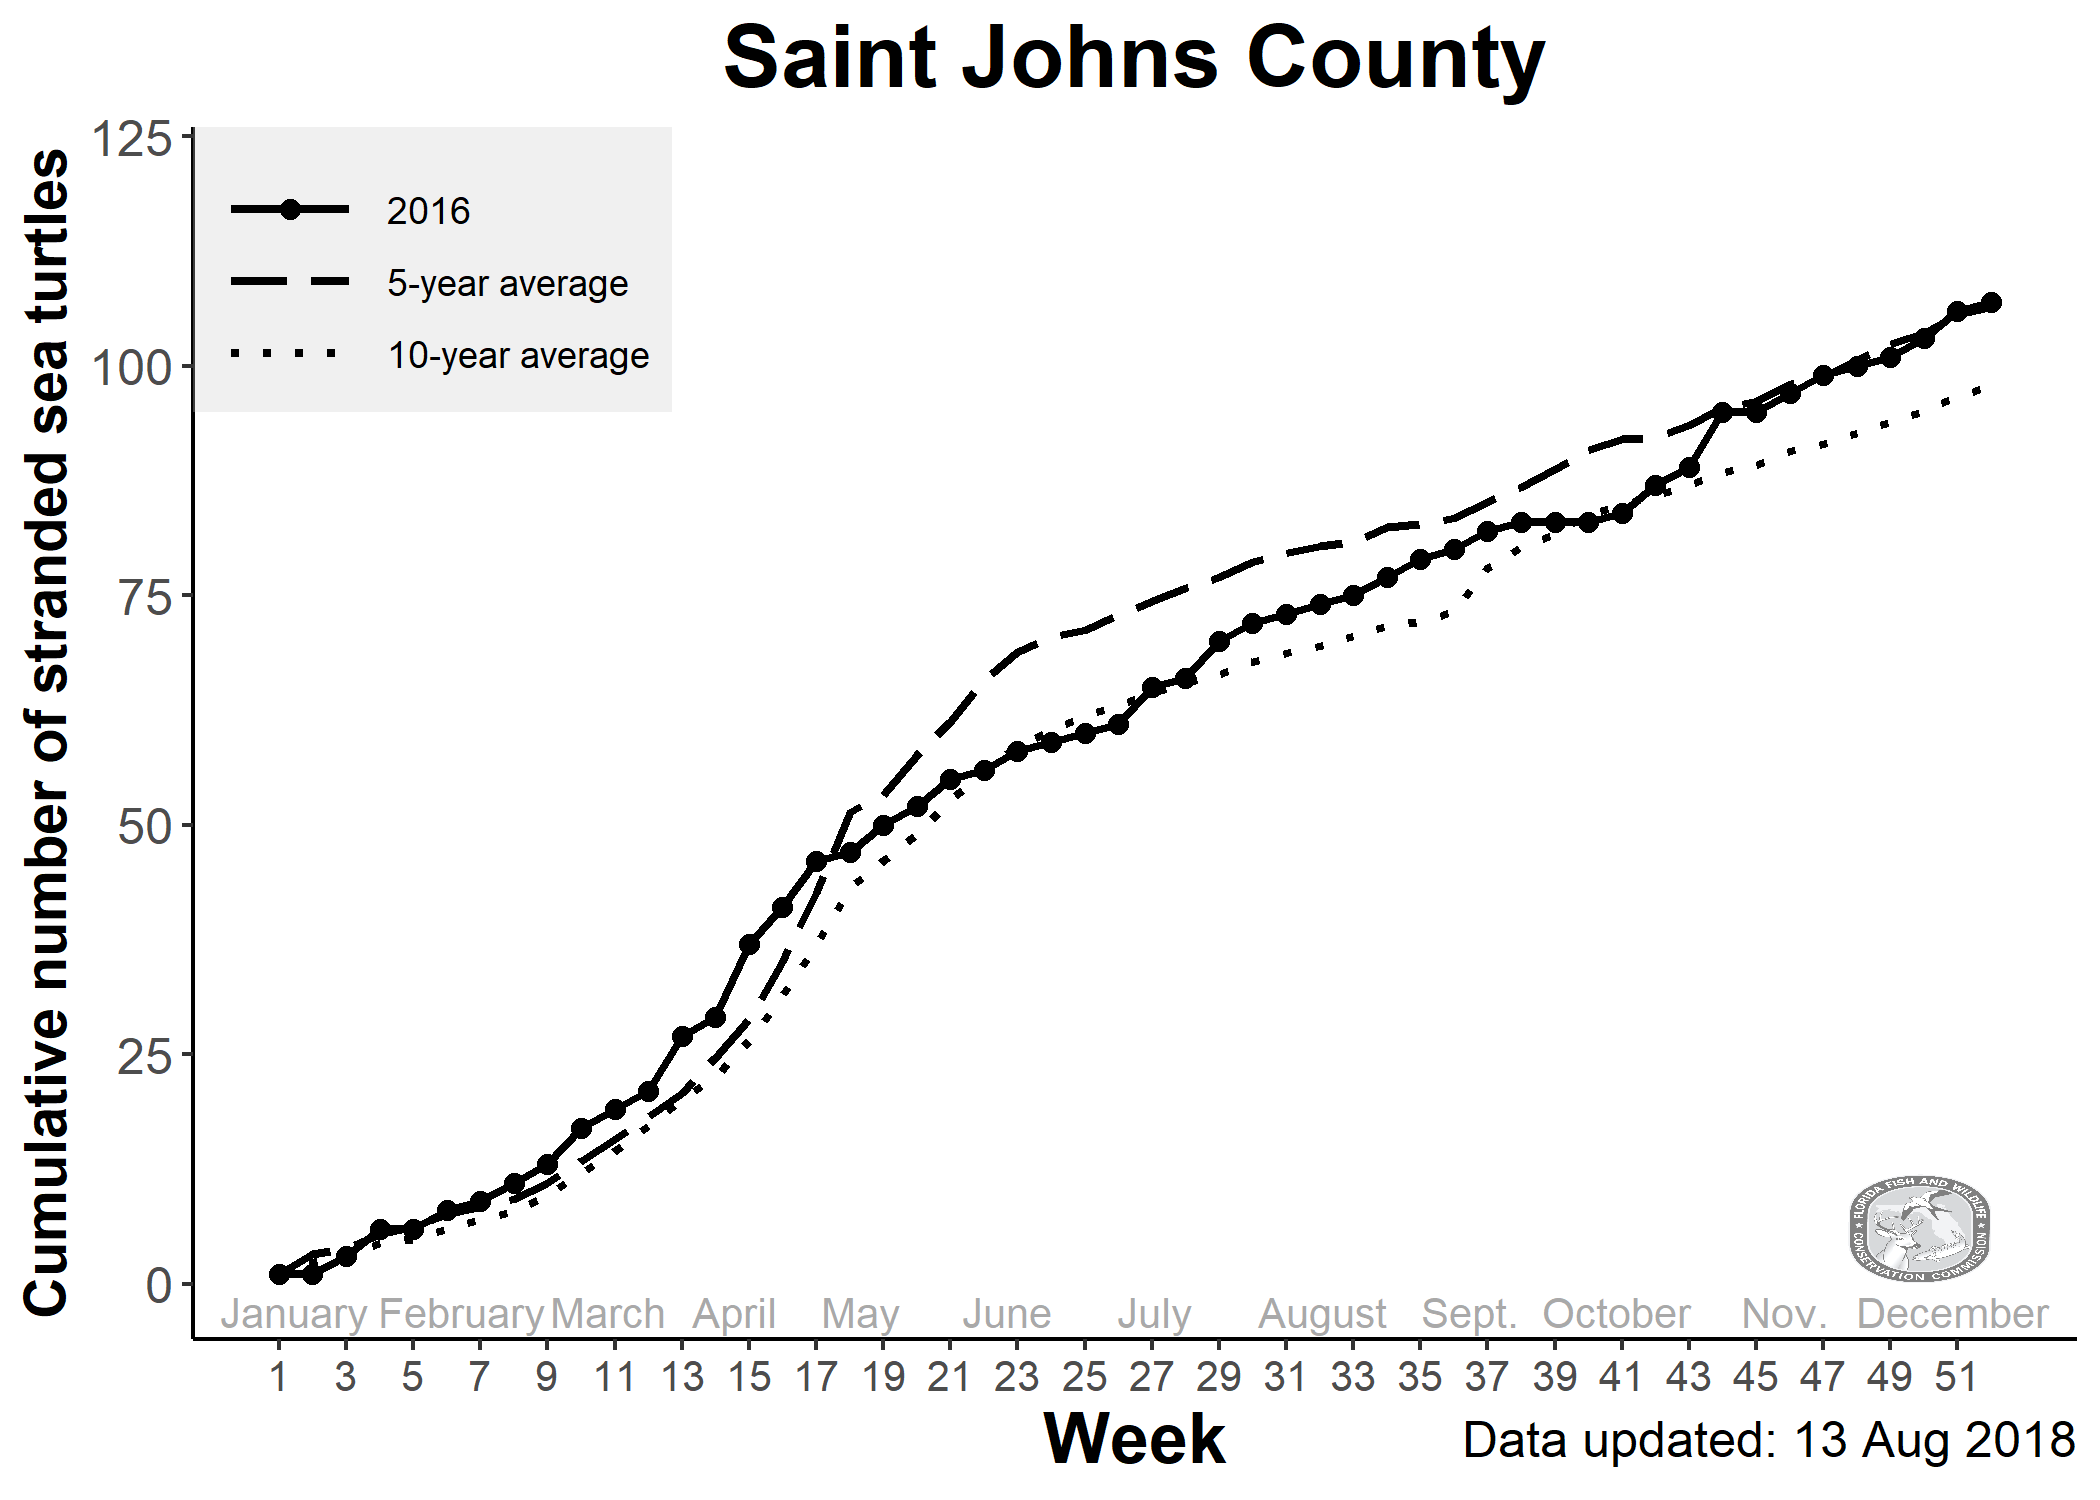
Cumulative numbers of stranded sea turtles in Saint Johns during 2016 and the previous 5-year and 10-year averages.
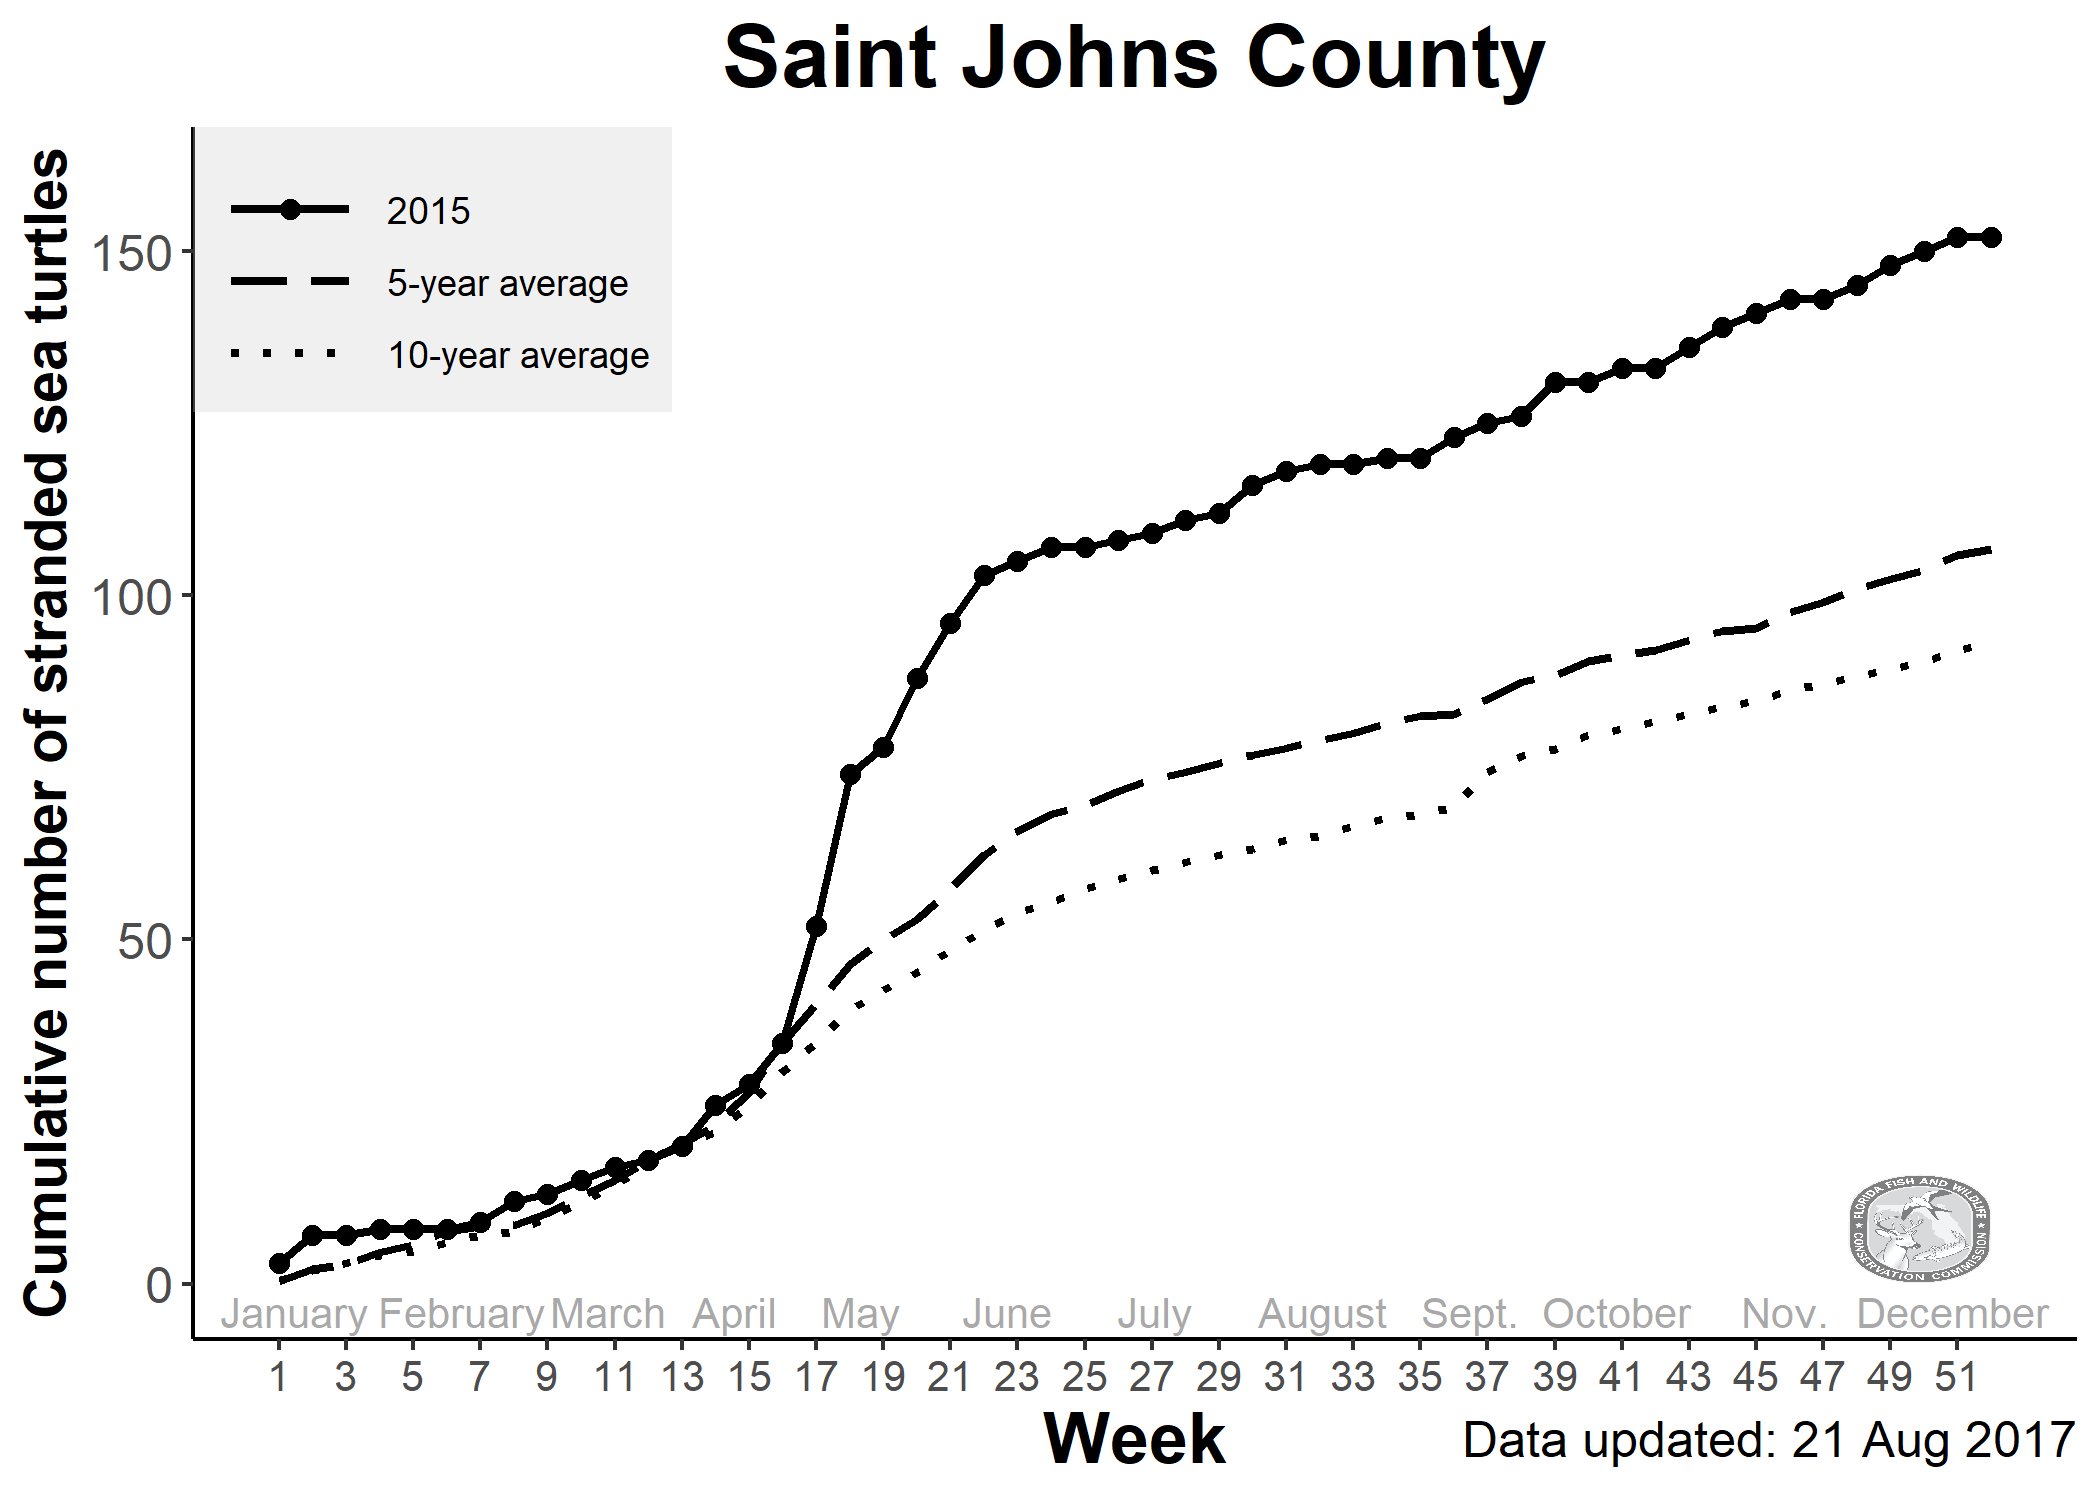
Cumulative numbers of stranded sea turtles in Saint Johns during 2015 and the previous 5-year and 10-year averages.
Northeast Florida:
These data are updated weekly. You may need to clear your browser's cache or refresh the page to see the most recent data.